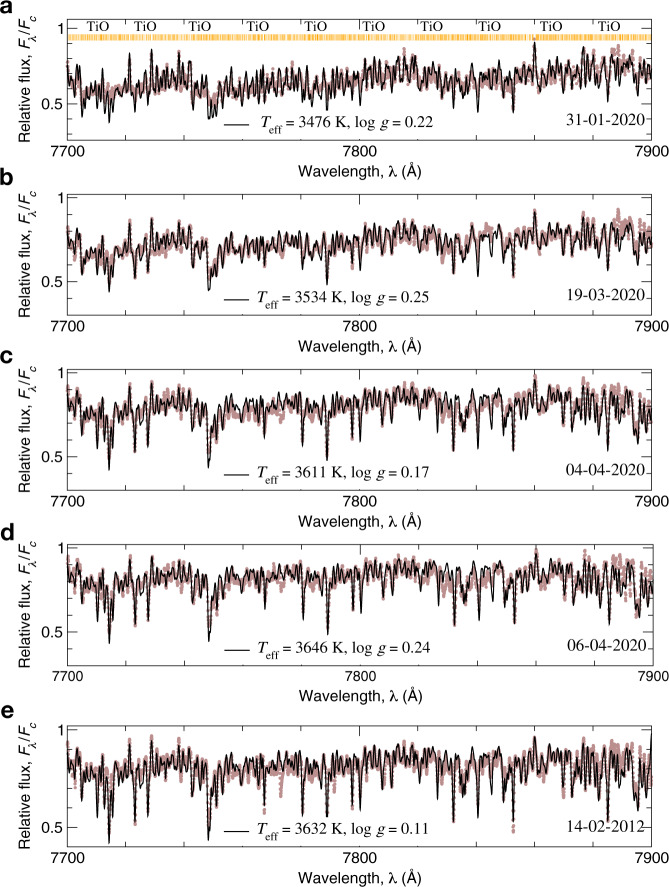
Fig. 7. Best fits to the molecular bands of TiO for five sets of spectra.
The observed spectra of Betelgeuse obtained on 31-01-2020 (a), 19-03-2020 (b), 04-04-2020 (c), 06-04-2020 (d), and 14-02-2012 (e) are shown by brown dots. The solid line is a theoretical profile calculated with the particular effective temperature (Teff) and surface gravity (log g), which were obtained in this study and presented on each panel. Relative flux is calculated as a ratio of the flux at a particular wavelength (Fλ) to the flux in continuum (Fc). The 2365 TiO lines are marked by vertical lines on the a. Source data are provided as a Source Data file.

