Figure 3.

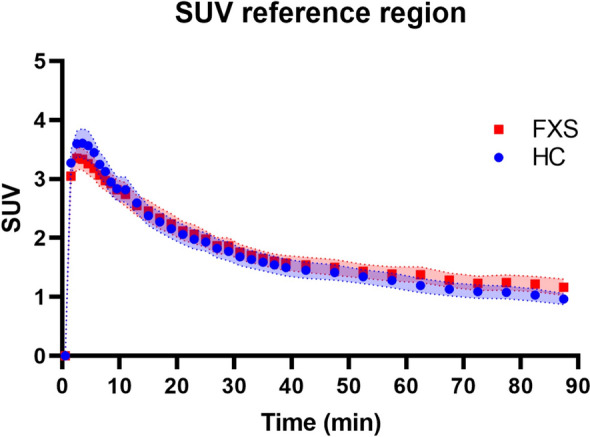
Mean time activity curves in the cerebellum white matter (reference region) for the control subjects (blue circle) and subjects with FXS (red square). Envelope represents standard error of the mean. SUV, standardized uptake value.

Mean time activity curves in the cerebellum white matter (reference region) for the control subjects (blue circle) and subjects with FXS (red square). Envelope represents standard error of the mean. SUV, standardized uptake value.