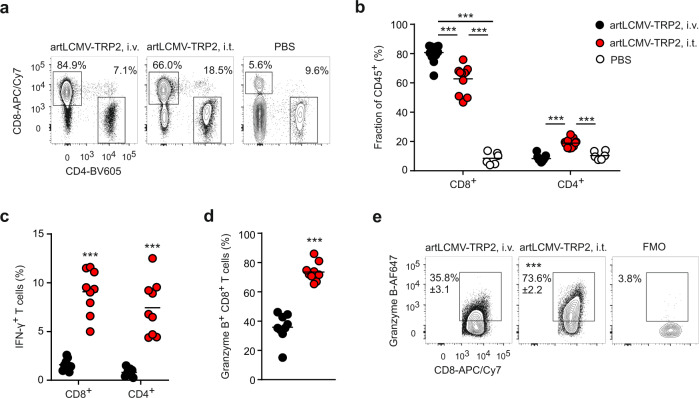
Fig. 2. T cell activity after intratumoral artLCMV-TRP2 treatment.
a–d B16F10-tumor bearing mice were treated on day 7 with artLCMV-TRP2 i.v. or i.t. Flow cytometric analysis of tumor-infiltrating T cells on day 15: Representative plots (a) and quantification of CD8+ and CD4+ T cell frequency (b). c IFN-γ-producing CD8+ and CD4+ T cells. Granzyme B-expressing CD8+ T cells (d) with representative plots (e). Dots represent individual mice and lines indicate mean values. Pooled data from two independent experiments with n = 6 (PBS), n = 13 (artLCMV-TRP2, i.v.) and n = 11 (artLCMV-TRP2, i.t.) mice (b); n = 9 (artLCMV-TRP2, i.v. and i.t.) mice (c, d). Statistical analysis was performed using one-way ANOVA with Tukey’s multiple comparison test (b) or unpaired two-tailed Student’s t test (c, d) with *P < 0.05: **P < 0.01; ***P < 0.001. Source data and exact P values are provided in the Source data file.

