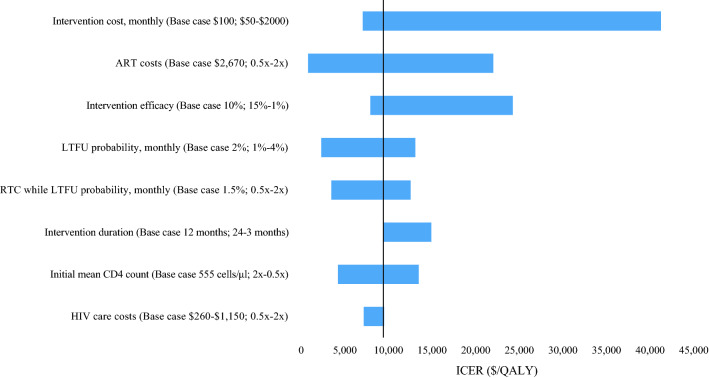
Fig. 2.
Sensitivity analyses: Incremental cost-effectiveness ratio of a 12-month adherence intervention (AI) compared to standard-of-care (SOC). Each parameter is varied through the range shown in parentheses, which is preceded by the base case input value. Incremental cost-effectiveness ratios (ICERs) for the comparison of adherence intervention to standard-of-care, in $/quality-adjusted life-year (QALY) are shown on the horizontal axis. The range of ICERs for each varied parameter is indicated by the blue horizontal bars. Longer blue horizontal bars indicate parameters to which the model results are more sensitive. The vertical black line represents the base case ICER. ART antiretroviral therapy, LTFU loss to follow-up, ICER incremental cost-effectiveness ratio, RTC return to care

