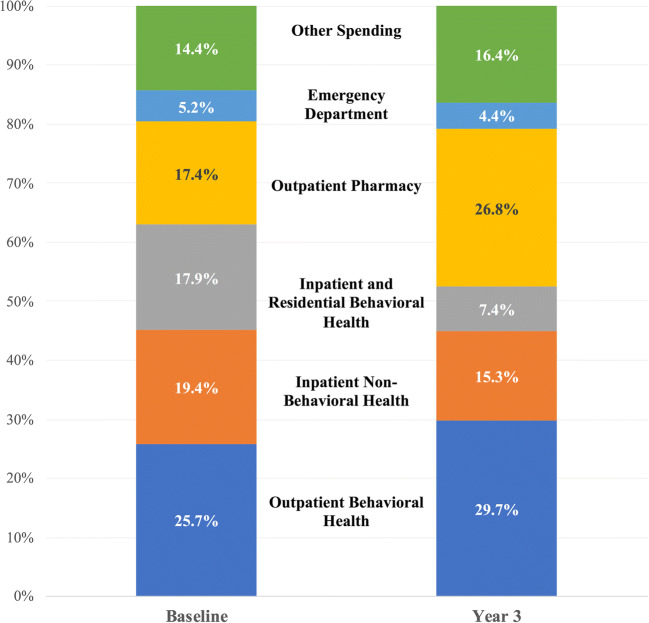
Fig. 2.
Spending as a proportion of total spending by the Permanent Supportive Housing cohort, baseline period and year 3. Adjusted spending as a proportion of total spending in the baseline period (7–15 months prior to entering PSH) and in the third year after entering PSH. Outpatient pharmacy spending and case management become a larger proportion of overall spending by year 3. Residential behavioral health care, inpatient behavioral health, and inpatient non-behavioral health become a smaller proportion of overall spending by year 3. Because we top-coded each spending variable to the 99th percentile to limit the influence of high-cost outliers, percentages may not align with calculated percentages in other figures.

