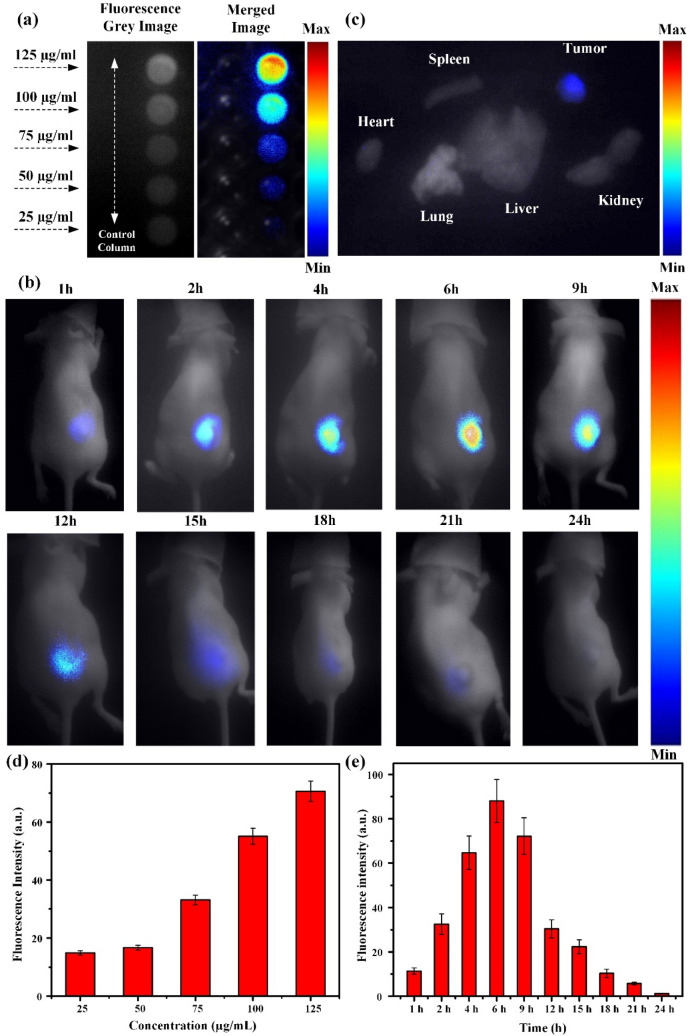
Figure 6.
(a) In vitro fluorescence imaging of control cells and MDA-MB-231 cell treated with different concentrations of IR-CS–PPy NCs (25, 50, 75, 100, and 125 μg/mL) (b) In vivo fluorescence imaging of MDA-MB-231 tumor-bearing nude mice at different time points after local injection of IR-CS–PPy NCs. (c) Ex vivo fluorescence imaging of the organs including, the heart, liver, lung, kidney, and spleen, and tumors excised from the mice treated with IR-CS–PPy NCs at 24 h post local injection. (d) The mean fluorescence intensities of different concentrations of IR-CS–PPy NCs were measured, displaying the highest fluorescence intensity at 125 μg/mL. (e) The mean fluorescence intensities of tumors were quantified at different time points, showing a peak value after 6 h injection of IR-CS–PPy NCs. Data are shown as the mean ± standard deviation (n = 3). Min = 0, and Max = 100.

