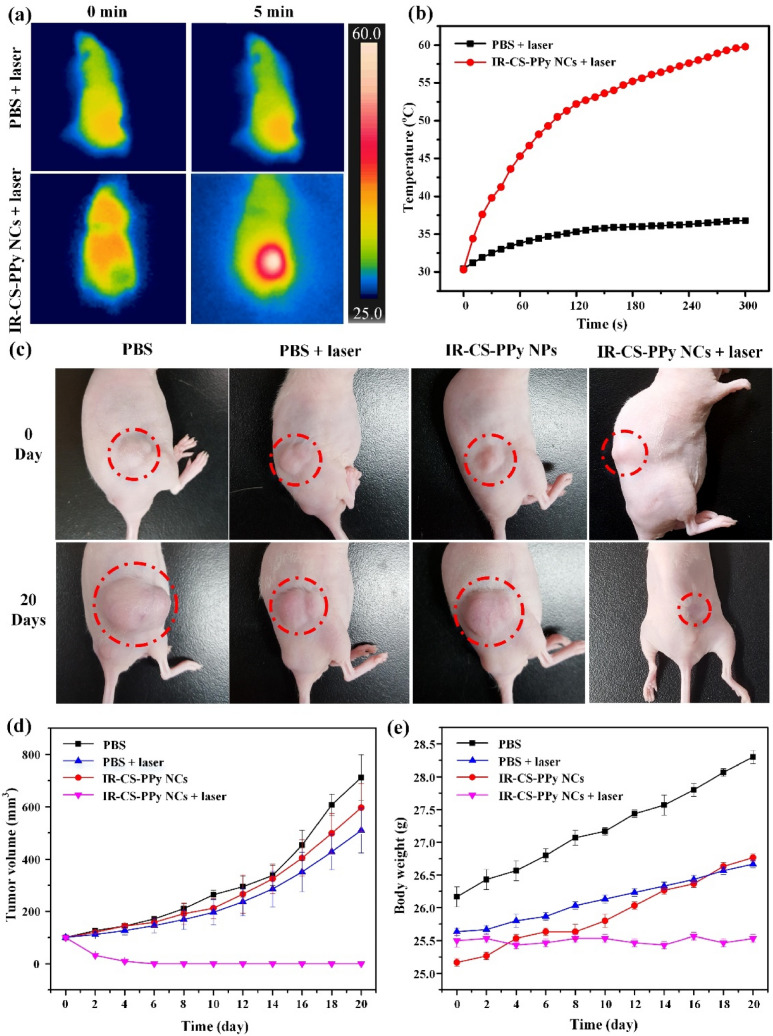
Figure 8.
(a) NIR thermographic images of tumor-bearing mice with intratumoral injection of PBS and IR-CS–PPy NCs with 808-nm NIR laser irradiation at 2.0 W/cm2 for 5 min. (b) Temperature change of tumor-bearing mice after intratumoral injection of with IR-CS–PPy NCs with 808-nm NIR laser irradiation at 2.0 W/cm2 for 5 min. (c) The digital photographs of tumor-bearing mice taken at day 0 before treatment and 20 days after treatment. (d) Tumor volume growth curves of different groups of mice after different treatments. Data presented as mean ± standard deviation. (n = 3). (e) The body weight after different treatments indicated in 20 days. Data are shown as the mean ± standard deviation (n = 3).

