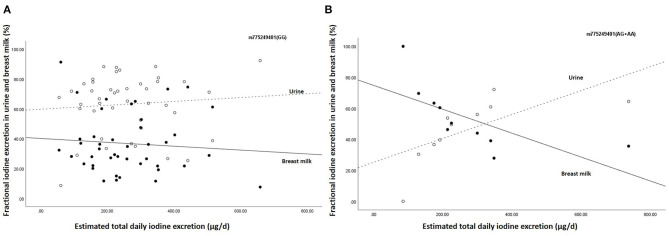
Figure 1.
Association between estimated daily iodine excretion and fractional iodine excretion in breast milk and urine for (A) the homozygous G group (n = 43) and (B) the (A) allele carriers (AA + AG) (n = 10). The open data points represent fractional excretion of iodine in urine and the filled data points, the fractional excretion in breast milk. The dotted line is the regression line for fractional excretion of iodine in urine. The solid line is the regression line for fractional excretion of iodine in breast milk.

