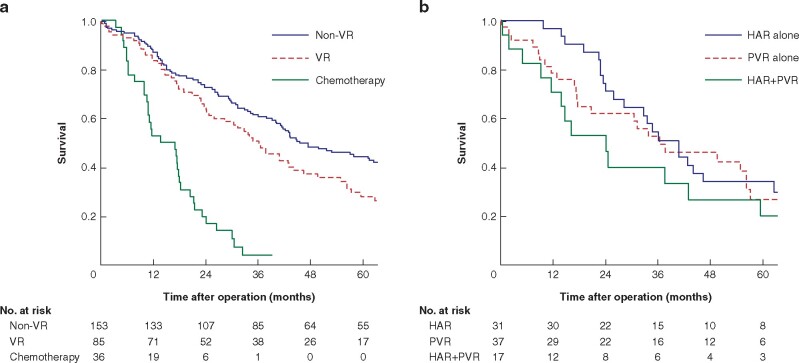
Fig. 3.
Kaplan–Meier curves showing survival
a Survival of patients who underwent hepatectomy with and without vascular resection and who were treated with chemotherapy. P = 0.124 (non-VR versus VR), P < 0.001 (VR versus chemotherapy), P < 0.001 (non-VR versus chemotherapy). b Survival of patients according to vascular resection status. P = 0.894 (HAR alone versus PVR alone), P = 0.285 (HAR alone versus HAR+PVR), P = 0.407 (PVR alone versus HAR+PVR) (log-rank test). VR, vascular resection; HAR, hepatic artery resection; PVR, portal vein resection

