Figure 2.

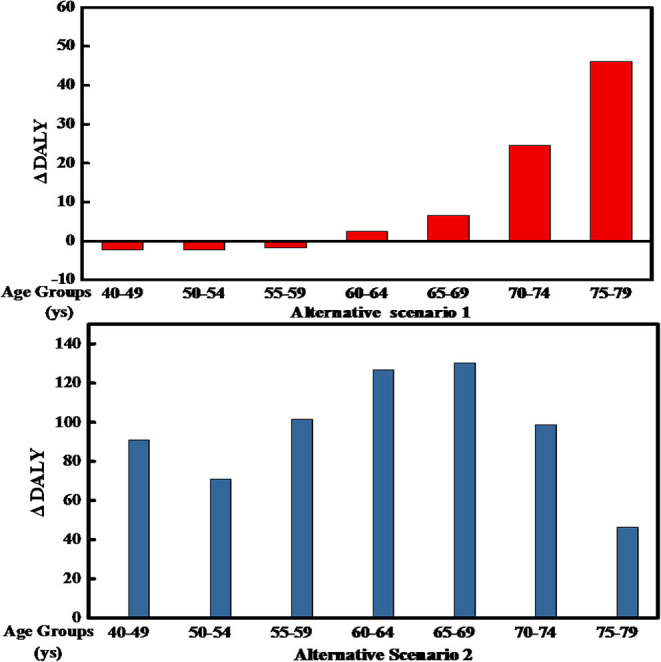
Difference in Disability-Adjusted Life Years (DALYs) for different scenarios and age groups of Chinese men. The bars represent the DALY difference between each group in the two ASs and the current consumption.

Difference in Disability-Adjusted Life Years (DALYs) for different scenarios and age groups of Chinese men. The bars represent the DALY difference between each group in the two ASs and the current consumption.