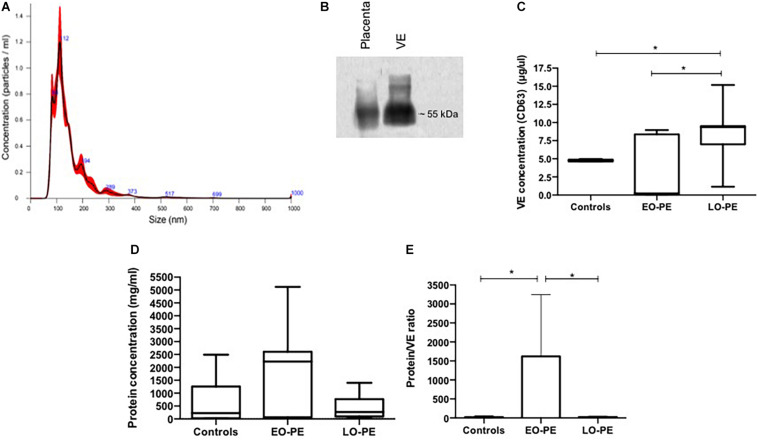
FIGURE 1.
VE characterization from explant culture supernatant. (A) Representative vesicle size distribution (nm) by NTA of VE. (B) Western blot analysis for the CD63 exosome marker. (C) Quantification of VE by ELISA measuring CD63 (controls vs. EO-PE p = 0,2069; controls vs. LO-PE p = 0,0262; EO-PE vs. LO-PE: p = 0,0175). (D) Quantification of protein within VE by Bradford method (controls vs. EO-PE p = 0,2069; controls vs. LO-PE p = 0,6031; EO-PE vs. LO-PE: p = 0,3129). (E) Analysis of ratio of protein quantity by VE (controls vs. EO-PE p = 0,0175; controls vs. LO-PE p = 0,3759; EO-PE vs. LO-PE: p = 0,0262) *p ≤ 0,05.

