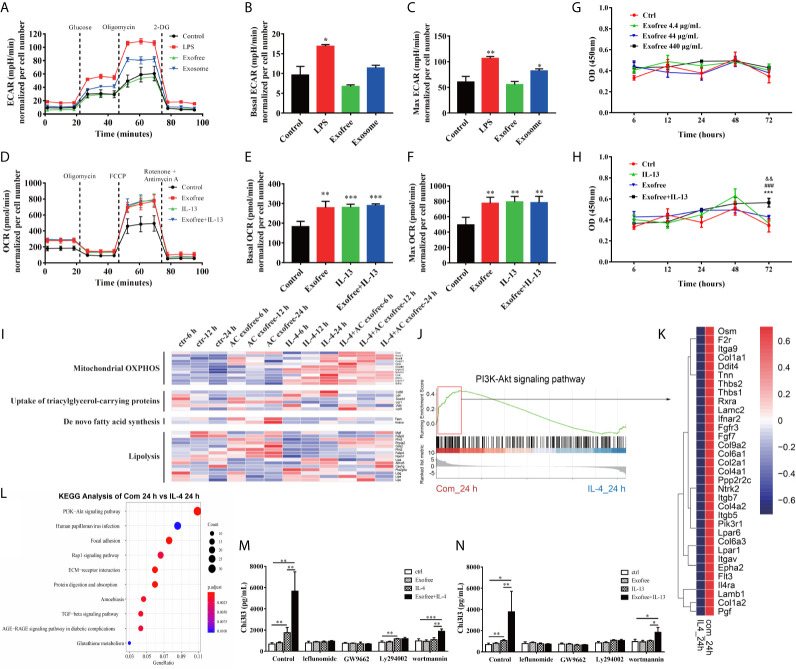
Figure 4.
Metabolic Reprogramming by the PI3K-Akt pathway plays a vital role in AC L4 exofree–induced M2 polarization of macrophages. (A–C) BMDMs were cultured for 24 h in medium alone or treated with LPS, exofree, exosome, and then the ECAR (A) was monitored using the Seahorse Bioscience extracellular flux analyzer in real time. Dotted lines indicate incubation of cells with the indicated compounds. Basal ECAR (B) and Max ECAR (C) of BMDMs were calculated. *P<0.05, **P<0.01, compared with the control group. In this experiment, LPS concentration is 0.05 μg/ml, AC L4 exosome concentration is 25 μg/ml, and AC L4 exofree concentration is 44 μg/ml. (D–F) BMDMs were cultured for 24 h in medium alone or treated with exofree, IL-13, or exofree+IL-13, and then the OCR (D) was monitored using the Seahorse Bioscience extracellular flux analyzer in real time. Dotted lines indicate incubation of cells with the indicated compounds. Basal OCR (E) and Max ECAR (F) of BMDMs were calculated. **P<0.01, ***P<0.001, compared with the control group. In this experiment, IL-13 concentration is 10 ng/ml, and AC L4 exofree concentration is 44 μg/ml. (G, H) Proliferation of BMDMs was determined with CCK8 assay at 6, 12, 24, 48, 72 h after treatment of PBS and exofree (G). AC L4 exofree concentration in this experiment is 4.4, 44, 440 μg/ml. (H) Proliferation of BMDMs was determined with CCK8 assay at 6, 12, 24, 48, 72 h after treatment of PBS, IL-13, exofree, IL-13+exofree. In this experiment, AC L4 exofree concentration is 440 μg/ml, and IL-13 concentration is 10 ng/ml. &&P<0.01, compared with the control group; ###P<0.001, compared with the IL-13 group; ***P<0.001, compared with the exofree group. (I) Gene expression profile of BMDMs related to mitochondrial OXPHOS, nutrient uptake, de novo fatty acid synthesis, and lipolysis metabolism process were shown in a heatmap. BMDMs were treated with PBS (ctr), free (AC L4 exofree), IL-4, com (IL-4+AC L4 exofree) for 6, 12, and 24 h, respectively. The horizontal axis represents genes, and vertical coordinates represent types of treatment. In this experiment, AC L4 exofree concentration is 440 μg/ml, and IL-4 concentration is 10 ng/ml. (J) GSEA analysis of genes enriched in PI3K-Akt signaling pathway was performed using R package “clusterprofiler.” (K) Signature genes enriched in PI3K-Akt signaling pathway through GSEA analysis were shown in a heatmap. (L) GO enrichment analysis (biological process) of highly expressed genes in the presence of IL-4 and AC L4 exofree, compared with IL-4 treatment, was performed using R package “clusterprofiler.” (M, N) BMDMs were treated with PBS, exofree, IL-13, IL-13+exofree (M), and PBS, exofree, IL-4, IL-4+exofree (N) in the presence of leflunomide (a STAT6 inhibitor), GW9662 (a PPARγ antagonist), Ly294002 (PI3K inhibitor), and wortmannin (PI3K inhibitor) for 24 h. The protein levels of Chi3l3 in the culture medium were measured using ELISA. The following reagents were used in this experiment: Leflunomide (100 μM), Ly294002 (10 μM), Wortmannin (100 nM), GW9662 (1 μg/ml). *P<0.05, **P<0.01.

