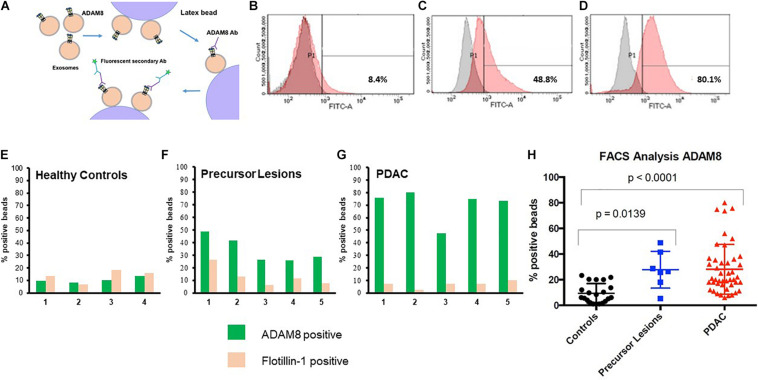
FIGURE 2.
Cartoon of protocol for flow cytometry (FACS) (A). FACS analyses of serum EVs isolated from healthy individuals (B), patients with precursor lesions (C) or PDAC (D), attached to beads and detected with ADAM8 antibody. Results with secondary antibody alone appear in gray and those with both ADAM8 antibody and secondary antibody appear in red. Exemplary comparison of results for FACS analyses of serum exosomes from healthy controls (n = 4, E), precursor lesions (n = 5, F) or PDAC (n = 5, G) with ADAM8 (green) or Flotillin-1 (ochre) antibodies. Graphic representation of results from FACS analysis of EVs isolated from healthy individuals, patients with precursor lesions or PDAC from the total cohort, attached to beads and detected with ADAM8 antibody (H).

