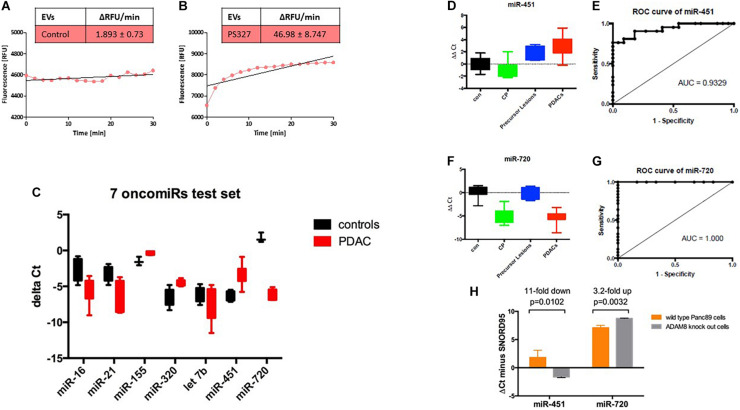
FIGURE 3.
Activity assay of ADAM8 in serum EVs isolated from healthy control (A) or PDAC patient (B). Results of the test set using 7 oncomiRs with black boxes, controls, and red boxes, PDAC patients (C). Boxplots of the (miR-451–Cel-54) (D) and (miR-720—Cel-54) (F) ΔΔCt values (patient minus healthy control) in the four groups (con, healthy control; CP, chronic pancreatitis; precursor lesions; and PDACs, pancreatic ductal adenocarcinoma). ROC curves for the comparison of exo-miR-451 (E) and exo-miR-720 (G) expression levels between patients with PDAC and healthy controls. ΔCt values for miRNAs isolated from EVs secreted by wild type Panc89 (orange) and ADAM8 knock-out cells (gray) (H).

