
. 2021 Jun 29;32(2):265–279.
Copyright © 2021 International Federation of Clinical Chemistry and Laboratory Medicine (IFCC). All rights reserved.
This is a Platinum Open Access Journal distributed under the terms of the Creative Commons Attribution Non-Commercial License which permits unrestricted non-commercial use, distribution, and reproduction in any medium, provided the original work is properly cited.
Figure 3.
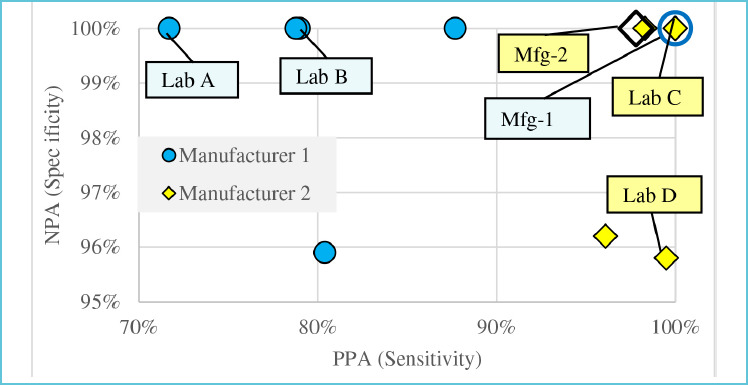
PPA & NPA for Mfg-1 and Mfg-2