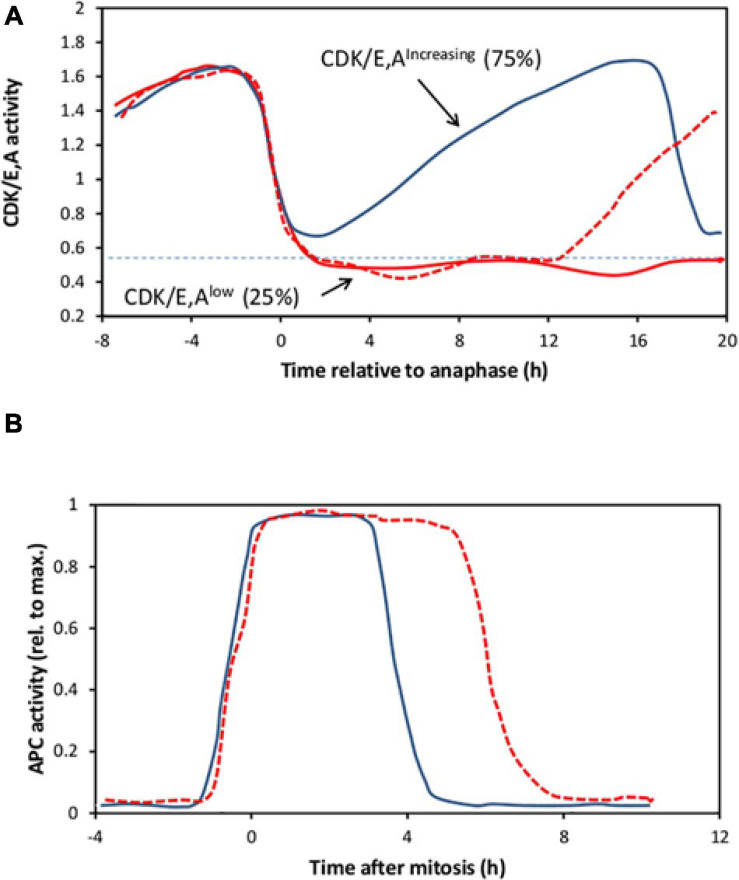
FIGURE 2.
A representation of live cell imaging data for CDK or APC activity. (A) Cartoon illustrating three single cell traces, aligned to anaphase, to indicate the range of CDK/E,A activity changes shown by individual MCF10A cells in a continuously cycling population, based on Figure 3B of Spencer et al. (2013). Following the drop in activity after mitosis, in roughly 75% of the cells (continuous blue line), activity immediately starts rising again to a peak at the next mitosis (“CDK/E,Aincreasing cells”). Although not indicated here, individual traces within this cohort, while following the same general pattern, nevertheless show a good deal of asynchrony. In the other 25% of the cells, activity falls to a low level (below the horizontal dotted line, at 2 h after anaphase, in this example). In these “CDK/E,Alow cells,” activity either remains low until the end of the experiment (continuous red line), or spontaneously starts rising again (dotted red line) as the cell switches to the CDK/E,Aincreasing state. (B) Cartoon of two single-cell traces to illustrate APC activity in cycling MCF10A cells, aligned to mitosis, based on Figure 4I of Cappell et al. (2016). APC activity rises sharply as cells enter mitosis then drops precipitously to a very low level several hours later. The abruptness of the fall is similar in all cells, but its timing varies, indicating considerable asynchrony between individual cells.

