Figure 2.
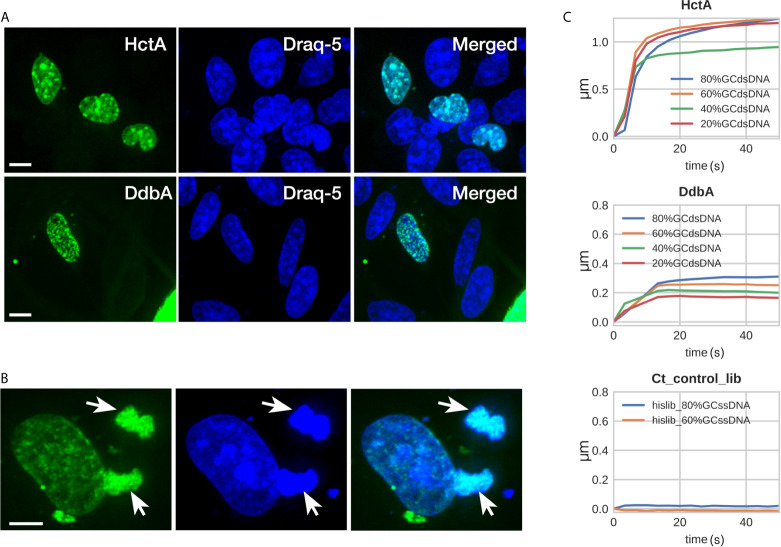
DdbA binds to DNA. Confocal images of DdbA ectopically expressed in HeLa cells (A, B) and Biolayer interferometry of purified DdbA with DNA (C) indicate an affinity for DNA. (A) HctA and DdbA were cloned and expressed with GFP-N terminal tags in HeLa cells. GFP signal is in green and DNA was stained with Draq5 (Blue) to highlight the nucleus. (B) Cell transfected with DdbA undergoing mitosis. Arrows indicate co-localization of the GFP signal with the mitotic chromosomes. Size bar = 10µm. (C) His-tagged DdbA and HctA were bound to a biolayer interferometry glass probe and binding measured using dsDNA ranging from 20%, 40%, 60% and 80% GC content. Both HctA and DdbA showed significant DNA binding with a maximal binding kinetics of 2.3 nM KD and 7.3 nM KD respectively. A his-tagged Ctr protein library (Ct_control_lib) was used as a negative control and showed no DNA binding (representative binding kinetics from one of three independent binding experiments).

