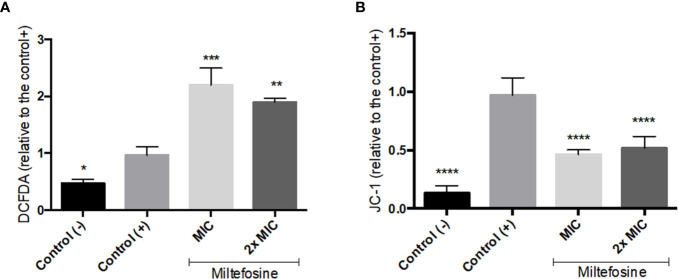
Figure 6.
The effect of miltefosine on oxidative stress (A) and the mitochondrial membrane potential (B) in Scedosporium aurantiacum after 6 h of incubation. DCFH-DA and JC-1 fluorescent staining was used to measure reactive oxygen species (ROS) production and membrane polarisation, respectively. Control (-) represents cells in the absence of fluorescent stain. Control (+) represents cells stained with fluorescent DCFDA or JC-1, but without miltefosine treatment. *p < 0.05, **p < 0.01, ***p < 0.001, ****p < 0.0001.

