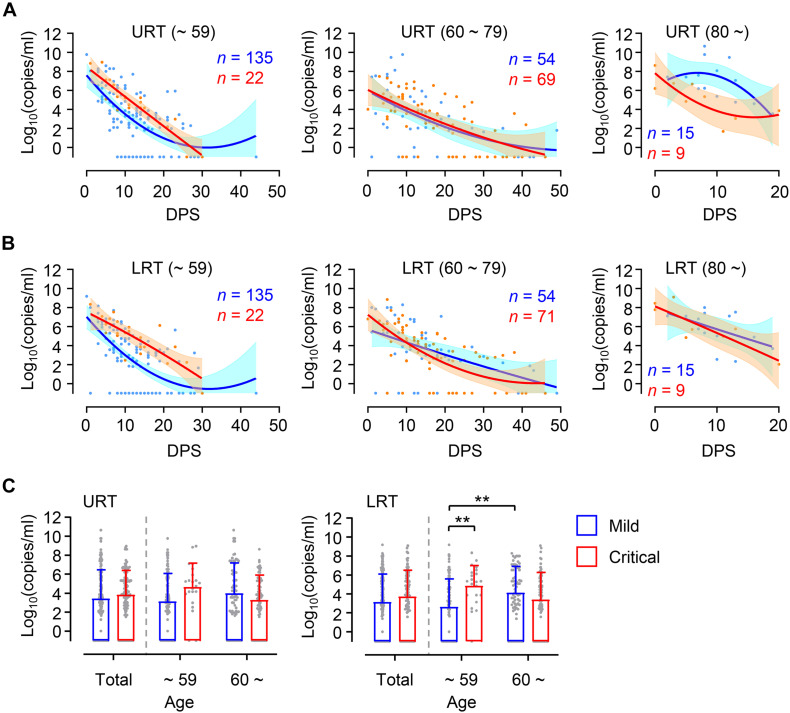
FIGURE 2.
Differential kinetics of respiratory viral load in young and old age groups. (A,B) Kinetic changes of viral loads in URT (A) or LRT (B) samples from the indicated age groups are presented. The blue and red lines show the trend in viral loads of mild and critical groups, respectively, using curve fit with non-linear regression with 95% confidence intervals (shaded color) from the regression line. The number of specimens are presented in the corresponding color. DPS, days post symptom onset. (C) Distribution of viral loads in URT (left) and LRT (right) samples from the indicated age groups are presented (mean + SD) at the indicated period. **p < 0.01 (two-tailed Mann–Whitney test for pairwise comparison between mild and critical groups in total or Kruskal–Wallis test for comparisons of values among different age groups).

