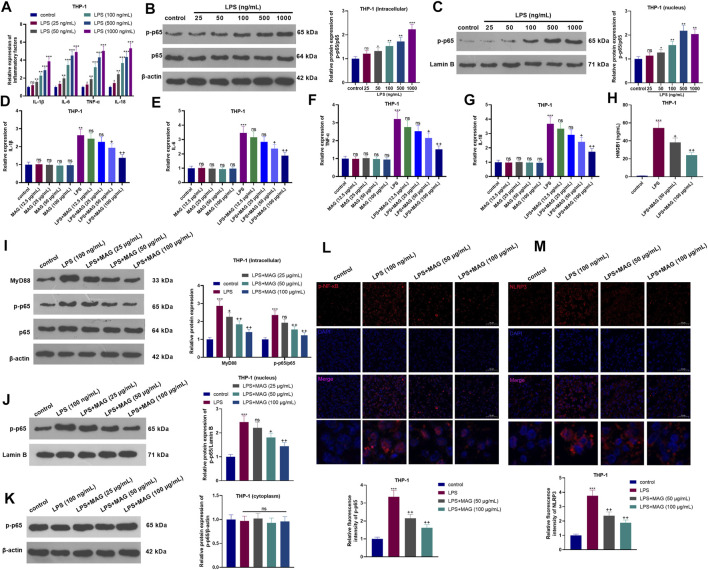
FIGURE 1.
Effects of MAG on the inflammation of “M1” polarized macrophages. THP-1 cells were treated with varying doses of LPS (25 ng/ml, 50 ng/ml, 100 ng/ml, 500 ng/ml, and 1,000 ng/ml) for 24 h. (A). The expression of IL-1β, IL-6, TNF-α, and IL-18 was compared by qRT-PCR. (B-C). Western blot was conducted to detect NF-κB pathway in THP1 cells. After treatment without or with LPS (100 ng/ml) for 24 h, THP-1 cells were treated with varying concentrations of MAG (12.5, 25, 50, and 100 μg/ml) for 24 h. (D-G). The expression of IL-1β, IL-6, TNF-α, and IL-18 was compared by qRT-PCR. (H). ELISA was applied to detect HMGB1 level in the supernatant of THP1 cells. (I-K). Western blot verified the expression of the MyD88-NF-κB pathway in THP1 cells. (L-M). Cell immunofluorescence was performed to detect p-NF-κB and NLRP3 in the TBP1 cells (×200). n = 3. ANOVA p < 0.01. ns p > 0.05, **p < 0.01, ***p < 0.001 (vs control group). ns p > 0.05, +p < 0.05, ++p < 0.01 (vs LPS group).

