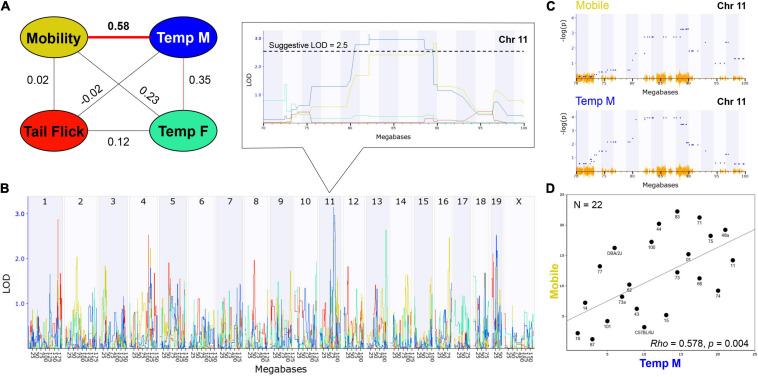
FIGURE 3.
THC Initial Response Trait Correlations and Genetic Co-Regulation. (A) Trait correlation network constructed after calculating Pearson’s correlation on ranked trait values to generate Spearman’s rank order correlation coefficient (Rho or P). The hypothermia trait was split by sex due to a condition-by-sex interaction effect on body temperature change in response to THC. Changes in time mobile in the open field and body temperature in males following a single THC (10 mg/kg) exposure are significantly (p < 0.01) correlated. Weak (not significant) correlations are also observed between mobility and hypothermia in females following a single THC exposure and between changes in male and female hypothermia in response to THC. (B) Genetic regulation of THC initial response traits is observed, albeit at a suggestive level with no traits passing the threshold for genome-wide significance (p < 0.05). Interval maps for each trait shown as a different line color corresponding to the correlation network in (A). The strength of association (LOD) on the y-axis is plotted for each trait across the genome (megabase position on each chromosome or Chr) on the x-axis. Change in mobility and male body temperature are regulated by the same suggestive locus on Chr 11 (zoomed region in boxed area). (C) Use of an alternative linear mixed-model QTL mapping method (GEMMA, see section “Materials and Methods”) resulted in replication of genetic co-regulation of initial motor and hypothermia THC response traits from the same Chr 11 interval. Strength of association or –log(P) values (y-axis) shown for each marker (blue dots) within the Chr 11 QTL interval for mobility and temperature (males) initial THC response traits. Mapping with linear mixed-models can account for population family structure or kinship within the BXD population that is not addressed using traditional interval mapping. SNP density plotted in orange on the x-axis. (D) Scatterplot describing the relationship between average change in time mobile in the open field in response to THC (X-axis) and average change in male body temperature in response to THC (Y-axis) for each BXD strain based on Spearman’s rank order correlation.

