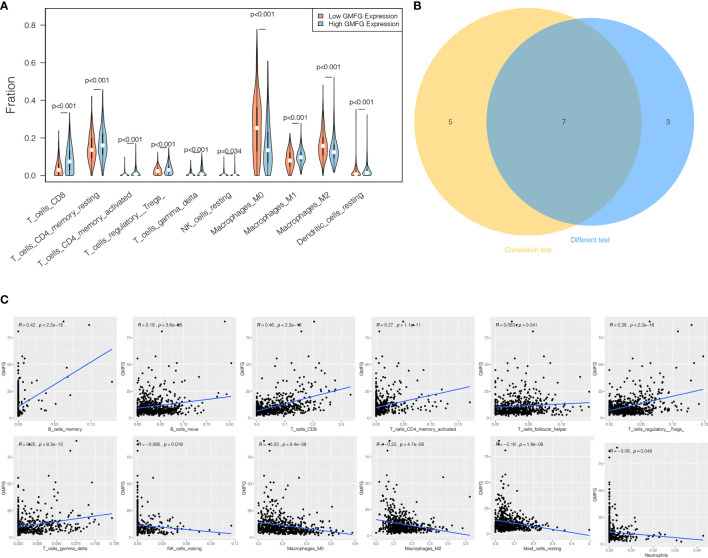
Figure 10.
Correlation between proportion of TIICs and expression of GMFG. (A) The violin chart displayed 10 kinds of immune cells with significant differences between GMFG-low-expression and GMFG-high-expression groups grouped by the median expression of GMFG. (B) The Venn diagram shown the 7 TIICs related to the GMFG expression, which are determined by the correlation and difference tests shown by the scatter diagram and the violin diagram, respectively. (C) The scatter diagram displayed the correlation between the expression of GMFG and the proportions of 12 TIICs ( p < 0.05).

