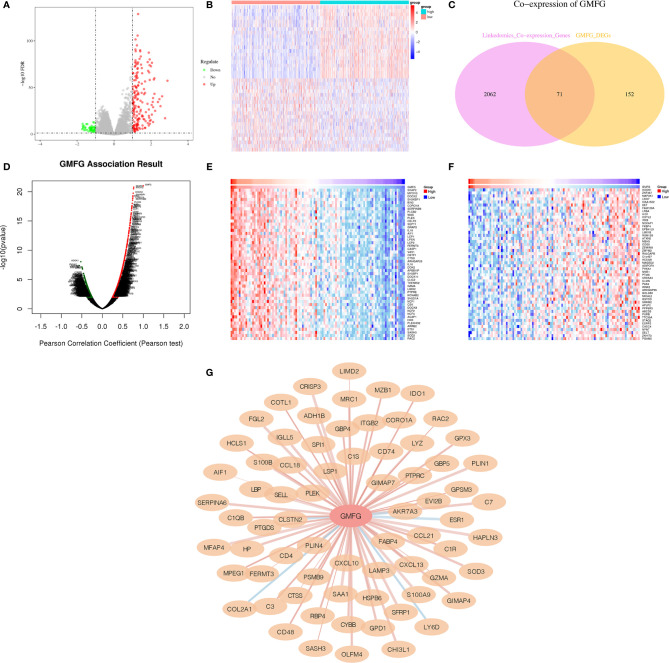
Figure 11.
Co-expressed genes of GMFG. (A) The volcano plots of differentially expressed genes of is based on differences in expression levels of GMFG. (B) The heatmap plots of top 20 up-regulated and down-regulated genes is based on differences in expression levels of GMFG. (C) Venn plot displayed 71 genes correlated with GMFG expression codetermined by GMFG-coexpressed genes from LinkedOmics and differential expression genes based on GMFG expression. (D) Pearson test in LinkedOmics was used to analyze co-expressed genes of GMFG in breast cancer. (E) The top 50 genes in LinkedOmics positively related to expression of GMFG in breast cancer. (F) The top 50 genes in LinkedOmics negatively related to expression of GMFG in breast cancer. (G) The network diagram shows the interaction between GMFG and its co-expressed genes. The red edges indicated a positive correlation with GMFG, and the blue edges indicated a negative correlation with GMFG. The width of the edge represented the strength of the correlation.

