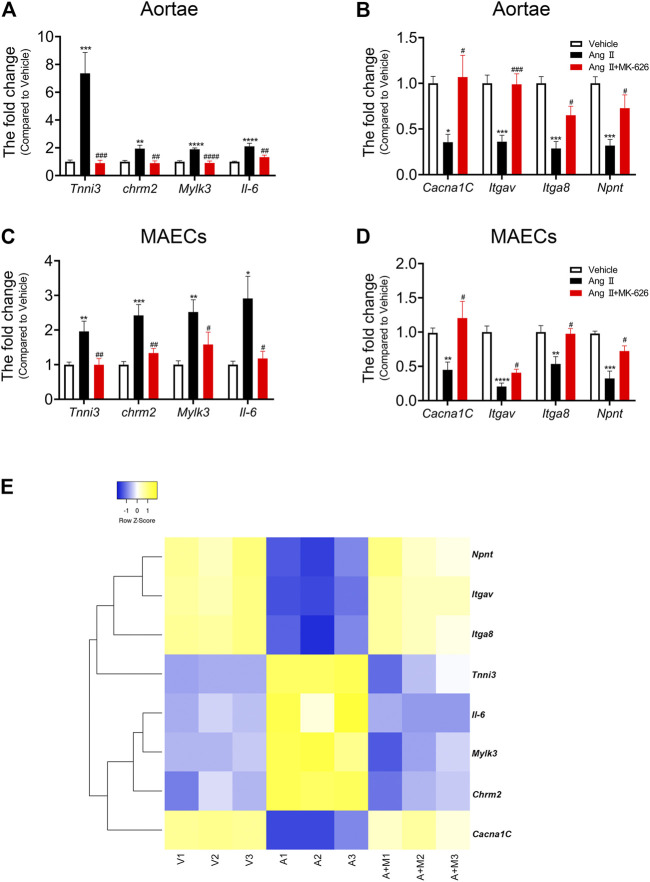
FIGURE 5.
mRNA verification and heatmap analysis. qRT-PCR validated the expression of eight candidate mRNAs in the aortae (A–B) and MAECs (C–D). (E) Heatmap for eight candidate mRNAs. * p < 0.05, ** p < 0.01, *** p < 0.001, **** p < 0.0001 vs Vehicle; # p < 0.05, ## p < 0.01, ### p < 0.001, #### p < 0.0001 vs Ang Ⅱ. Data are expressed as mean ± SEM (n = 6–9 for aortae, n = 4–6 for endothelial cells). V, Vehicle; A, Ang Ⅱ; A + M, Ang Ⅱ + MK-626; MAECs, mouse aortic endothelial cells.

