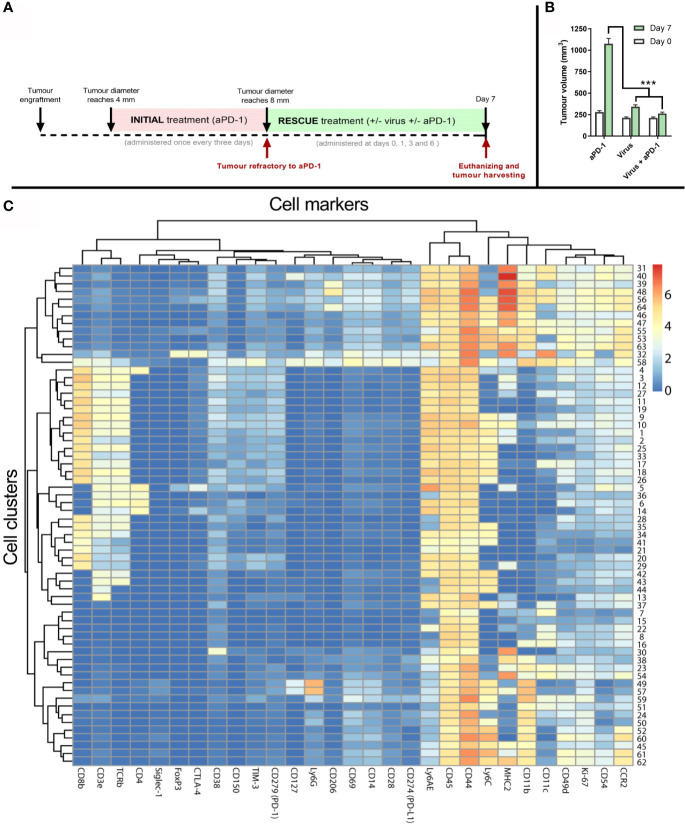
Figure 4.
Tumor samples and analysis to study mechanism of action of the treatments. (A) Experimental design: 27 mice carrying B16.OVA tumors were treated with aPD-1 until they became refractory to the drug as described previously. Subsequently, those animals were assigned to groups where animals were treated with the same aPD-1 regimen (n=9), with 1x10⁸ VP intratumorally once every three days (n=9), or both (n= 9). Four rounds of treatments were given at days 0, 1, 3 and 6 after they were considered refractory and sacrificed at day 7 for tumor collection. (B) Average tumor volumes (and SEM) at day 0 (when they qualified as refractory) and day 7 (when tumors were harvested). (C) Heatmap after the analysis of tumors by CyTOF and subsequent processing of the data by FLOWSOM providing 64 different cell clusters for immune (CD45+) cells. (Mann Whitney test; ***p < 0.001).

