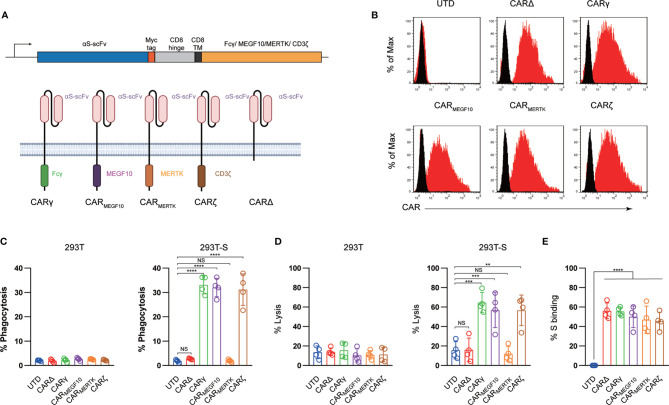
Figure 1.
Generation and characterization of CAR macrophages. (A) Vector maps of tested CAR designs and schematics showing the structures of CARs used in the study. Figure created with BioRender. (B) Membrane-bound CAR expression. Forty-eight hours after retroviral transduction, the expression of synthetic receptors on THP-1 cells was detected by staining with an anti-MYC antibody, followed by flow cytometry analysis. Untransduced THP-1 cells were used as a negative control. The histograms shown in black correspond to the isotype controls, whereas the red histograms indicate positive fluorescence. (C) FACS-based phagocytosis of 293T cells or 293T-S target cells by UTD or different CAR macrophages. Statistical significance was calculated with one-way ANOVA with multiple comparisons. (D) Killing of 293T or 293T-S cells by UTD or anti-S CAR macrophages at 24 h assessed with a luciferase-based assay. (E) Flow cytometry analyses of CAR macrophages stained with a biotinylated S protein followed by streptavidin-FITC. The histograms shown in black correspond to the use of isotype controls with streptavidin-FITC, whereas the red histograms indicate positive fluorescence. The results shown represent three (B) independent experiments. Data are the shown as the mean ± s.d. of four independent biological replicates (C–E). P values were derived by one-way ANOVA followed by Tukey’s posttest (C–E). **p<0.01, ***p<0.001, ****p<0.0001. NS, Not Significant. The circles represent individual data.

