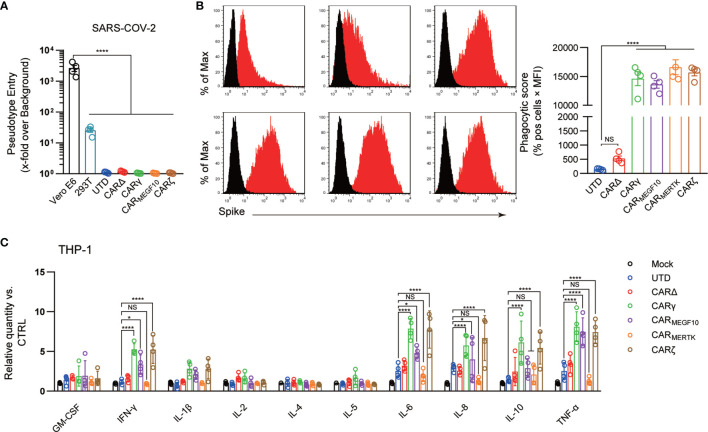
Figure 2.
CARs mediate phagocytosis of SARS-CoV-2 virions. (A) Different cell lines were inoculated with a SARS-CoV-2 pseudotyped virus. At 16 h post inoculation, pseudotyped virus entry was analyzed by determining the luciferase activity in cell lysates. Signals obtained for particles bearing no envelope protein were used for normalization. The average of three independent experiments is shown. Error bars indicate the SEM. (B) The uptake of pseudotyped virions by UTD and CAR macrophages was analyzed by flow cytometry. Different cell lines were stained with an anti-S primary Ab. The histograms shown in black correspond to the isotype controls, whereas the red histograms indicate positive fluorescence. Data are reported as the phagocytic score (% positive cells x MFI, right panel). (C) Cell lines were infected with the SARS-CoV-2 pseudotyped virus or mock infected. Cytokine levels in the supernatants were determined by a multiplex bead array. The relative level was calculated as the ratio of the infected cells to the mock-infected THP-1 cells. Data are shown as the mean ± s.d. (A–C) of four independent biological replicates. P values were derived by one-way ANOVA followed by Tukey’s posttest (a–b) or two-way ANOVA followed by the Bonferroni posttest (C); *p<0.05, ****p<0.0001. NS, Not Significant. The circles represent individual data.

