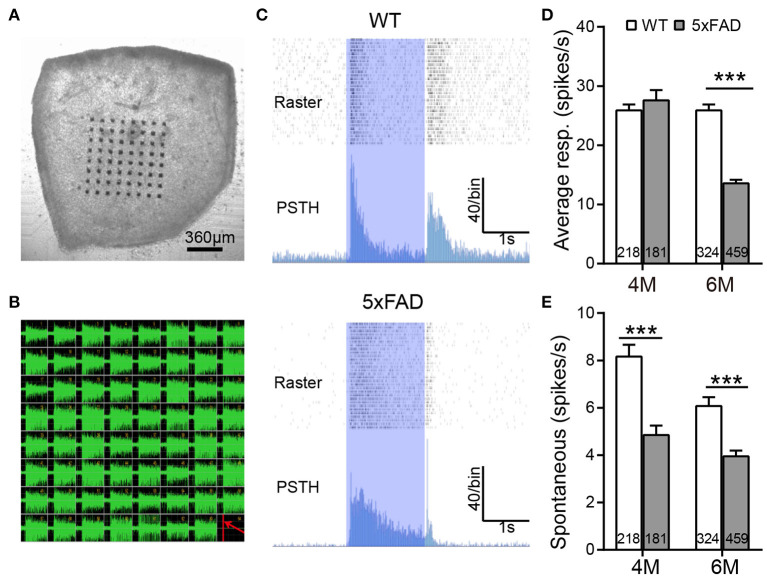
Figure 6.
The light response of individual ganglion cells is reduced in 5xFAD mice at 6 months. (A) Illustration of an isolated retinal tissue placed on an 8×8 multielectrode array. (B) Spikes recorded from each electrode in response to a saturated flash (light intensity (4.68 × 10⁷ photons/μm2/s) whose onset is indicated by a red line in the lower right corner of the array. (C) Examples of spiking responses from WT and 5xFAD RGCs. For each cell, the top panel shows a raster plot from 30 repeats, and the bottom panel shows the corresponding PSTH. The 2-s light stimuli are indicated as blue regions. (D) Average firing rate of RGCs within the 2-s light stimuli was significantly reduced at 6 months in 5xFAD. (E) Spontaneous firing was greatly decreased in 5xFAD mice at both 4 and 6 months. The numbers within the bars represent the number of responsive cells recorded from retinas of three animals. ***p < 0.001, two-way ANOVA.

