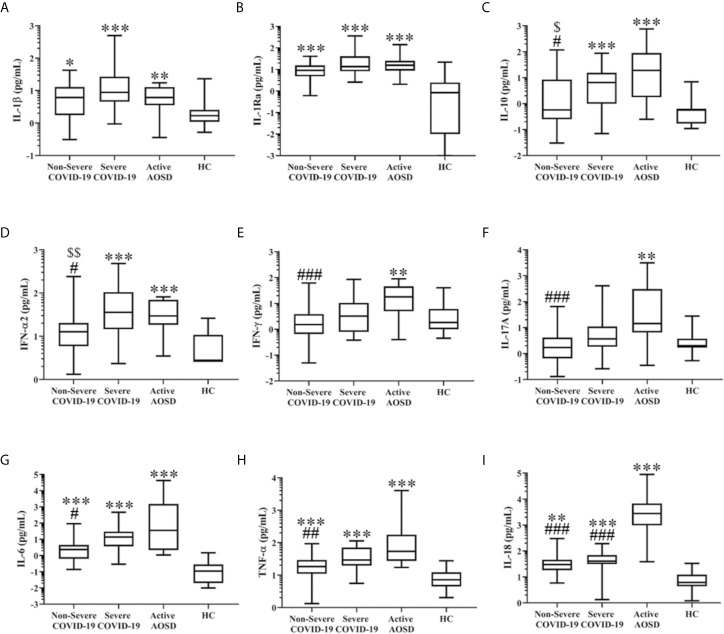
Figure 2.
Comparison of plasma levels of cytokine profiles in COVID-19, AOSD and HC. The difference in levels of IL-1β (A), IL-1Ra (B), IL-10 (C), IFN-α2 (D), IFN-γ (E), IL-17A (F), IL-6 (G), TNF-α (H), and IL-18 (I) among non-severe COVID-19, severe COVID-19, active AOSD, and healthy control (HC). COVID-19, coronavirus disease 2019; AOSD, adult-onset Still’s disease; IFN, interferon; IL, interleukin; IL-1Ra, interleukin-1 receptor antagonist; TNF-α, tumor necrosis factor-α. Data are presented as a logarithmic scale and box-plot diagrams, with the box encompassing the 25th percentile (lower bar) to the 75th percentile (upper bar). The horizontal line within the box indicates median value respectively for each group. *p-value < 0.05, **p-value < 0.01, ***p-value < 0.001, versus HC; #p-value < 0.05, ##p-value < 0.01, ###p-value < 0.001, versus AOSD patients; $p-value < 0.05, $$p< 0.01, versus severe COVID-19 patients, determined by the Kruskal-Wallis test with a post-hoc Dunn’s test.

