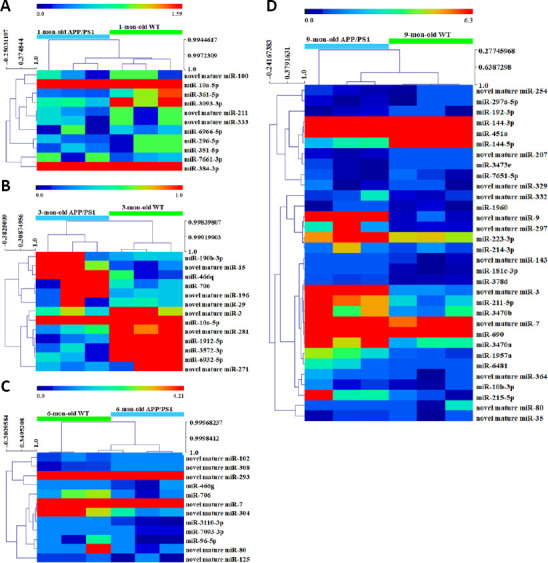
Figure 3.

Hierarchical cluster analysis of differentially expressed miRNAs in APP/PS1 mice at 1 (A), 3 (B), 6 (C), and 9 months (D) of age.
The expression cluster tree is shown on the left, while the sample cluster tree is shown on top. The relative level of miRNA is shown by the color change, whereby red indicates high expression and blue indicates low expression. APP: Amyloid-beta peptide precursor protein; miRNA: microRNA; PS1: presenilin 1; WT: wild type.
