
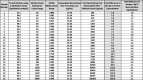
Table 2.
Standard curve interpolated titers of 25 SARS-CoV-2 positive samples with high and low % neutralization. Neutralizing antibody titers from OD450 values taken from the linear range of diluted samples (as exemplified in Fig. 4 – circled points in each panel) interpolated from the monoclonal neutralization antibody (GenScript: #A02051) standard curve (as shown in Fig. 3D). The titers are then multiplied by the associated sample dilution factor (described in Fig. 3E) used for standard curve interpolation to give the “Final Neutralizing Titer” from which the “Fold Difference to Sample 1 By Titer” can be calculated. Also represented are the “% Neutralization Using 1:20 Dilution Factor” values used for qualitative analysis (first column) and the associated “Fold Difference to Sample 1 By % Neutralization” (last column).
 |