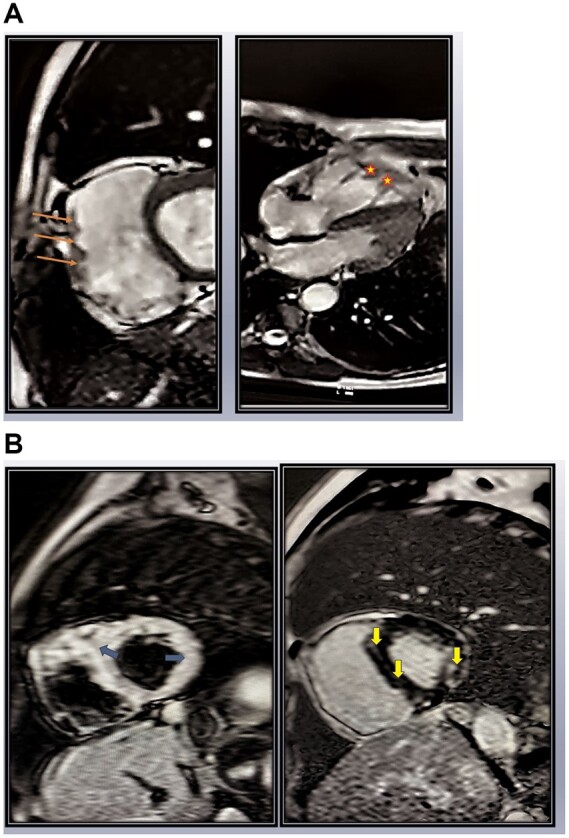
Figure 3.

(A) Cardiac magnetic resonance imaging: left panel: short-axis view showing dilated right ventricle with focal outpouchings (orange arrows) in free wall and right panel: four-chamber view showing trabeculations and serrated margins of right ventricle apex (marked as stars). (B) Cardiac magnetic resonance imaging: left panel: short-axis T2w image showing hyperintensity (blue arrows) in segments of left ventricular and interventricular septum suggestive of myocardial oedema. In right panel, the hyperintense segments shown in left panel colocalize with selective subepicardial late gadolinium enhancement (yellow arrows), suggestive of myocarditis in evolution with fibrosis.
