FIGURE 7.

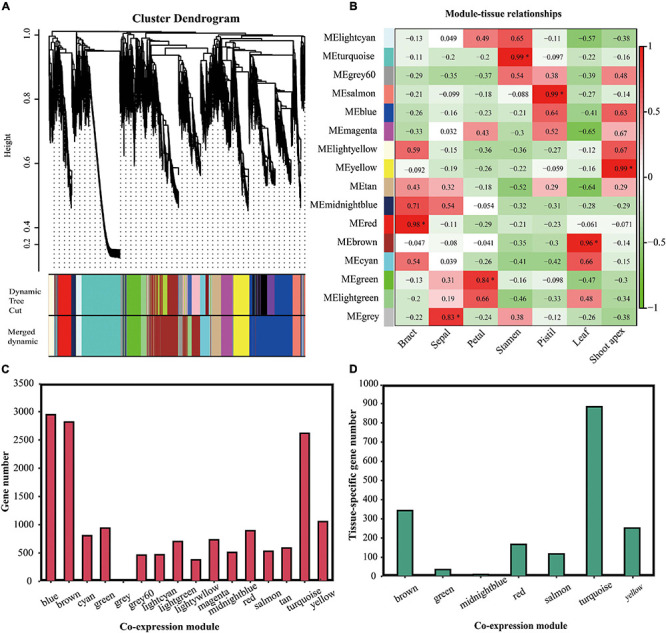
Analysis of the gene co-expression modules. (A) Dendrogram of the gene co-expression modules in L. chinense. The genes are represented by vertical lines in the upper panel. In the bottom panel, rectangles of thirteen colors represent the 16 gene co-expression modules. (B) Relationships between tissues and gene co-expression modules. The asterisk indicates that the co-expression module is significantly correlated to the tissue. (C) Analysis of the gene numbers in the 16 co-expression modules. (D) Analysis of the tissue-specific genes in the 16 co-expression modules.
