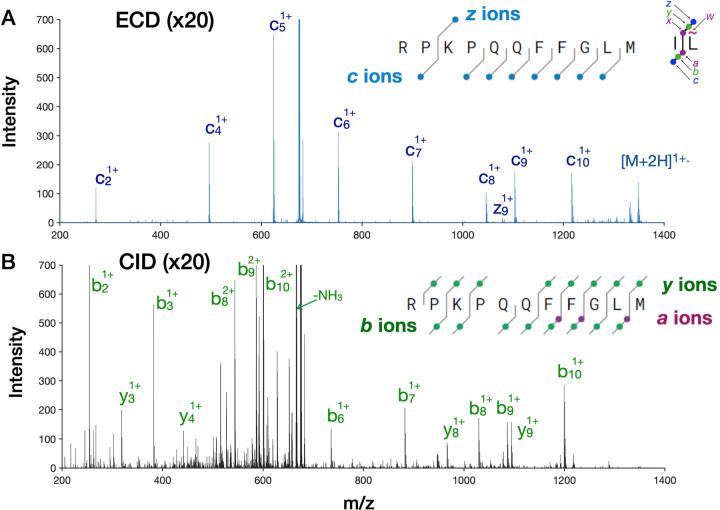
Figure 3.
Comparison of ECD with CID of Substance P. (A) ECD spectrum. (B) Corresponding CID spectrum with 22 V of activation and collected under identical conditions as the ECD spectra. In each case, 10 spectra collected at 20 Hz were averaged to reduce stochastic baseline noise. The multiple small peaks in the CID spectrum remained unchanged with longer signal averaging.

