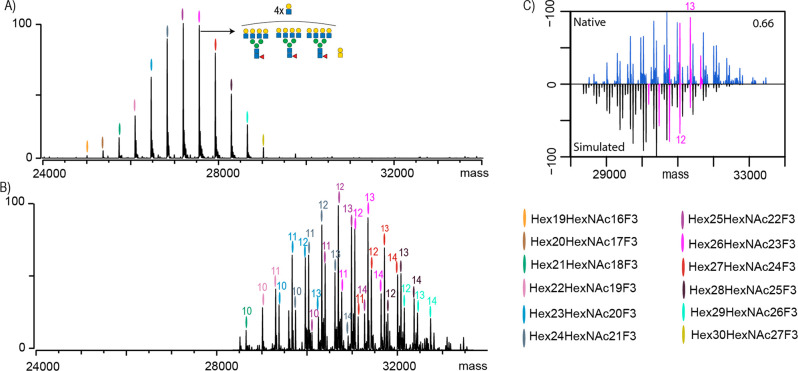
Figure 1.
Analysis of EPO-1 by native MS and bottom-up glycoproteomics. (A) Native MS spectrum of desialylated EPO-1, where each peak is color-coded and represents a unique Hexx+3HexNAcxF3 composition. One of the most abundant peaks is annotated with its most likely glycan composition. (B) Native MS spectrum of non-sialidase-treated EPO-1 where the numbers above the color codes indicate the cumulative number of sialic acid residues attached to the EPO glycans. Upsized spectrum is available as Figure S1. (C) Comparison and cross-correlation of the native MS data (blue) of non-sialidase-treated EPO-1 with a simulated intact mass spectrum based on the GluC-digest glycoproteomics data. Highlighted in pink are peaks belonging to a Hex26HexNAc23F3 composition carrying between 9 and 14 sialic acids.

