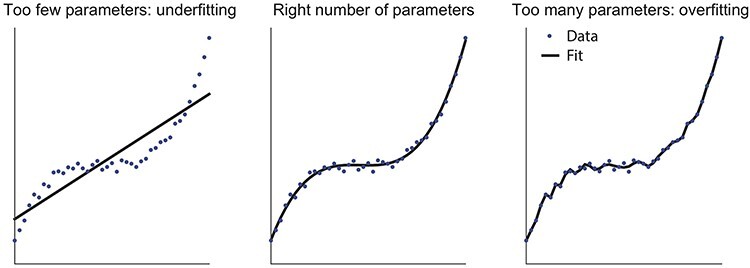
Fig. 5.

Model complexity when comparing models. Example showing simulated datapoints in blue and three fits (black) ranging from linear (one parameter, left), to cubic (three parameters, middle) to 10th order (10 free parameters, right). This illustrates the concept of underfitting (left), where the model is too simple and does not capture the underlying structure of the data, vs overfitting (right) which describes situations in which the model captures not just the structure but also the noise that is specific to the dataset and which will not generalize to new instantiations of the same underlying task structure. The right level of complexity (middle) should capture the structure, but not the noise present in the data. Model comparison can help determine the right level of complexity, but it is a debated topic with multiple options to choose from.
