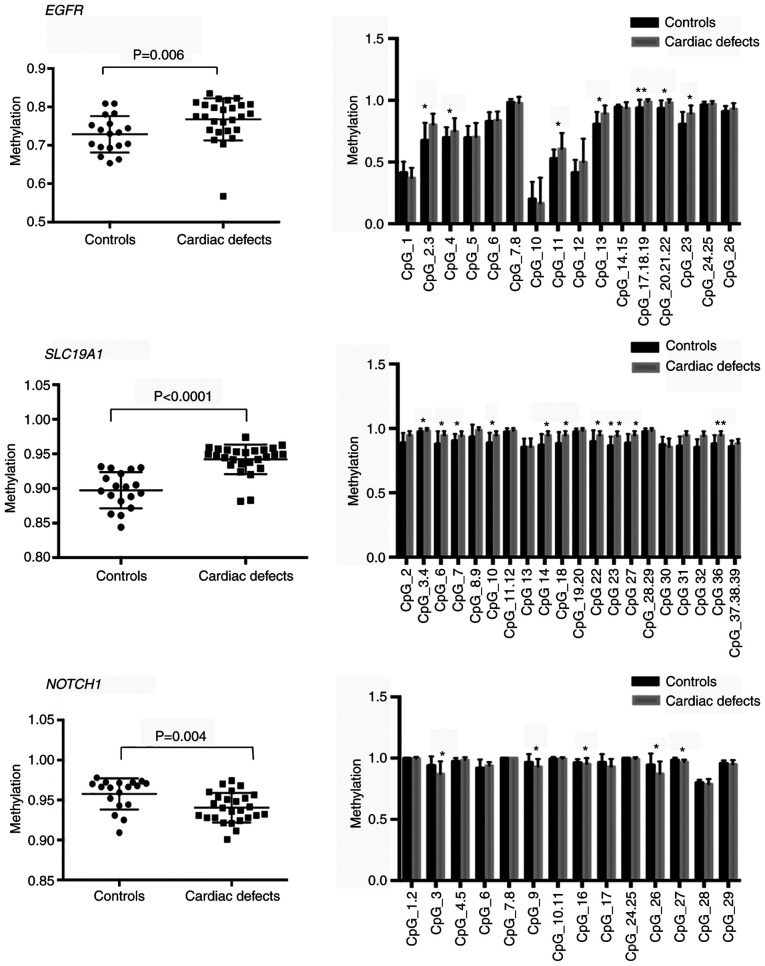
Figure 7.
Percentage methylation comparisons between controls (n=18) and cases with cardiac defects (n=26) at differentially methylated regions corresponding to EGFR, SLC19A1, and NOTCH1. Columns represent mean percentage methylation values, and the error bars represent standard deviation. *P<0.05 and **P<0.001. EGFR, epidermal growth factor receptor; SLC19A1, solute carrier family 19 member 1.

