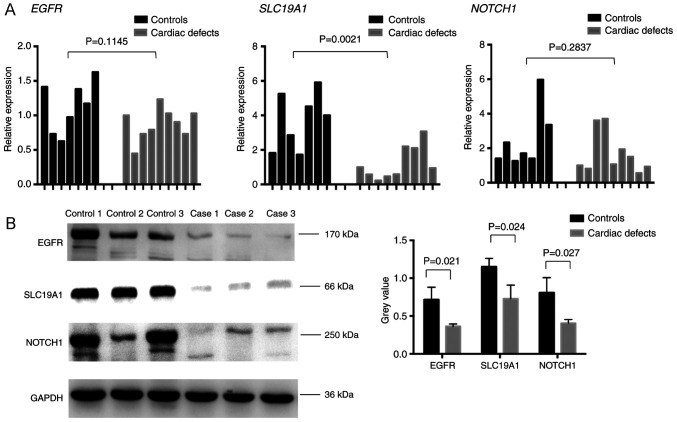
Figure 8.
Validation of EGFR, SLC19A1, and NOTCH1 expression. (A) mRNA expression levels were examined by reverse transcription-quantitative PCR in single fetal hearts from seven normal controls (black bars) and nine cases with cardiac defects (gray bars). (B) Representative images and quantification of protein expression levels as determined by western blot analysis. EGFR, epidermal growth factor receptor; SLC19A1, solute carrier family 19 member 1.

