FIGURE 6.
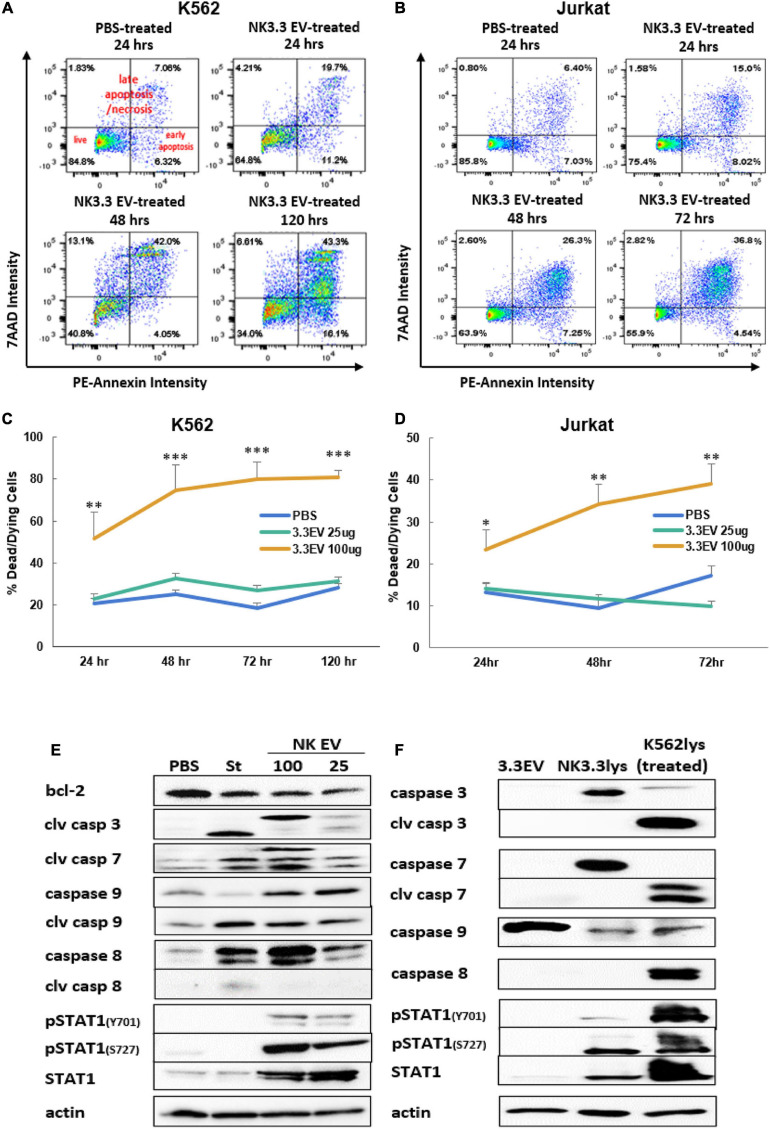
Induction of apoptosis in leukemia cells and alterations in K562 protein expression by treatment with NK3.3-derived EVs. Leukemia cells treated with either PBS, 25 or 100 μg/ml NK3.3 EVs were stained for annexin V and 7-AAD and analyzed by flow cytometry. Representative scatter plots are presented for (A) K562 cells and (B) Jurkat cells. Graphs of the cumulative apoptosis data collected by flow cytometry are shown for (C) K562 cells and (D) Jurkat cells. Dying/dead cell frequency is the sum of all annexin V- and 7AAD-positive quadrants. Mean frequency ± SE; n = 6. ∗p ≤ 0.05, ∗∗p ≤ 0.005, ∗∗∗p ≤ 0.0005. (E) Immunoblots of K562 protein lysates from cells treated for 24 h with PBS, 2.5 μM staurosporine (St), 100 μg/ml NK3.3 EVs (100), or 25 μg/ml NK3.3 EVs (25); 25 μg protein per lane was used. (F) Comparison of protein expression from NK3.3-derived EVs (3.3EV), NK3.3 cells (NK3.3lys), or K562 cells 24 h post- 100 μg/ml NK3.3 EV treatment (K562lys). Lysates were prepared, and immunoblotting performed to assess the potential contribution of NK EV-associated proteins to NK EV-treated K562 cells (25 μg of protein per lane).

