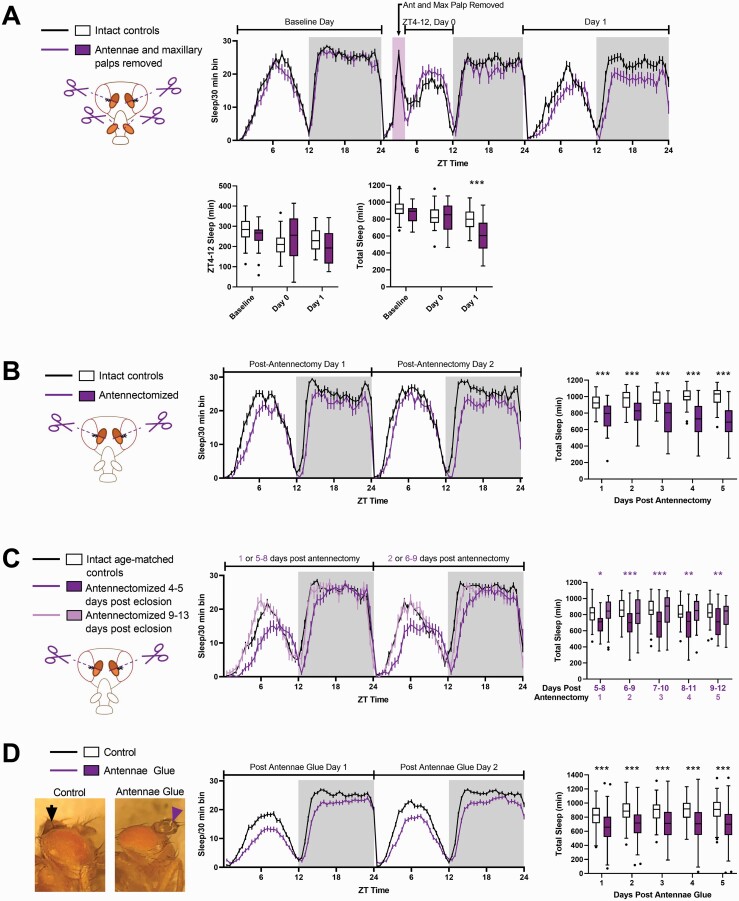
Figure 1.
Physical manipulations of the antennae (antennectomy and antennae glue) result in sleep loss in young flies. (A) Top panel shows the amount of sleep per 30 min bin on the day preceding, on the day of, and on the day following antennectomy. The pink rectangle represents the time during which flies were removed from the DAM system and had their antennae and maxillary palps removed. Sleep during lights on immediately following antennae and maxillary palp removal (day 0, ZT4–12) was slightly but not significantly greater than that of intact controls (bottom left panel). Total sleep on the first day following antennae clip was significantly reduced, however (bottom right panel). Intact control flies (n = 32). Antennectomized flies (with maxillary palps removed, n = 30). *p < 0.05, **p < 0.01, ***p < 0.001 by Mann–Whitney test. (B) Left panel shows amount of sleep per 30 min bins during the first two full days following antennectomy (starting with ZT0 the day following antennectomy) of flies 4–5 days old. Right panels show amount of sleep per day following antennectomy. Intact control flies (n = 33) and antennectomized flies (n = 32). *p < 0.05, **p < 0.01, ***p < 0.001 by Mann–Whitney test .(C) Flies antennectomized at 9–13 days old (n = 48, light-lavender) do not show sleep loss on the first day following antennectomy, relative to age-matched controls (n = 54, black lines in top panel and white boxes in bottom panel). Left panel shows the amount of sleep per 30 min bins of flies antennectomized at 4–5 days old (n = 38, dark purple), flies antennectomized at 9–13 days old (n = 48, light-lavender), and intact age-matched controls (10–14 days old at the time indicated as “1 or 5–8 postantennectomy,” black). Dark purple asterisks indicate significant differences between the intact controls (n = 54) and flies antennectomized 4–7 days before loading (n = 38). Light lavender asterisks indicate significant comparisons between intact controls and flies antennectomized on the day of loading (n = 48). *p < 0.05, **p < 0.01, ***p < 0.001 by Kruskal–Wallis test with Dunn’s multiple comparison test. (D) Far left panel shows examples of flies with their antennae glued (purple arrowheads) and control flies with glue in the top center cuticle (black arrowheads). Middle panel shows the amount of sleep per 30 min bin during the first two full days following antennae glue. Far right panel show the difference between day (left panel) and night (right panel) sleep in control flies (n = 124) versus those with their antennae glued (n = 136). *p < 0.05, **p < 0.01, ***p < 0.001 by Mann–Whitney test.

