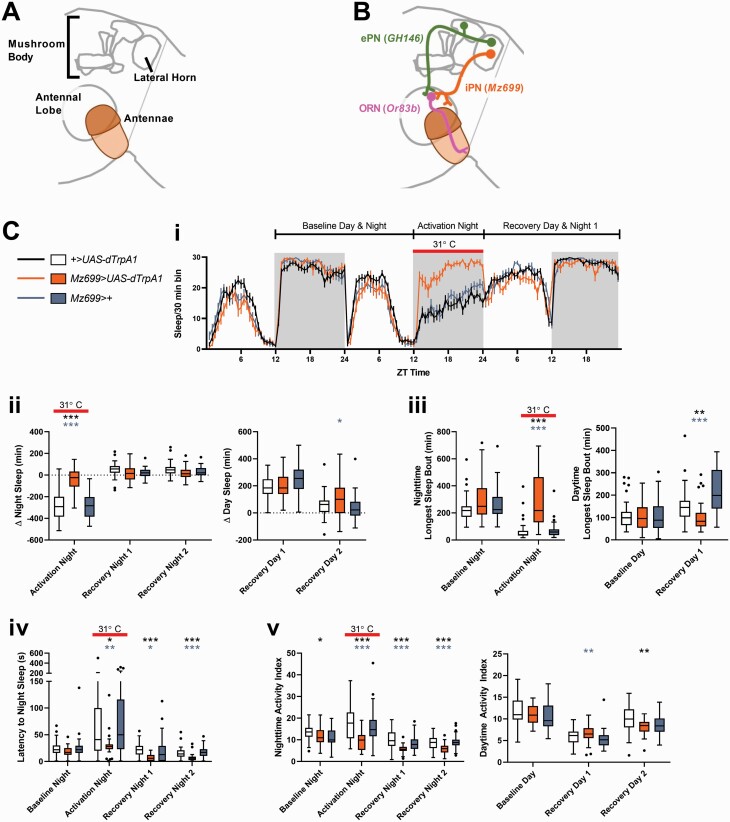
Figure 4.
Activating second order inhibitory projection neurons at night increases sleep. (A) Schematic illustrating the antennae and the three major neuropil involved in olfactory processing—the antennae lobe, the mushroom body, and the lateral horn. (B) Schematic illustrating the anatomical relationships between the ORNs (pink), the ePNs (green), and iPNs (orange) and the respective neuropil they innervate. In subsequent figures, only the relevant neuronal population will be colored, with pink representing populations that are silenced via UAS-kir2.1 and orange representing populations that are activated by UAS-dTrpA1. (C) Activating secondary order inhibitory projection neurons at night increases sleep. Panel (i) shows the amount of sleep during the baseline, experimental, and recovery days in 30 min bins over the 24 h day as reported by multibeam monitors. The time at which the temperature was raised from 18°C to 31°C, which activates iPNs in the experimental genotype Mz699>UAS-dTrpA1 (shown in orange), is indicated in all panels with the solid red line. Panel (ii) shows the difference between sleep on the night iPNs were activated and the night before (left) and the difference in sleep daytime sleep between the day following activation and the preceding day (immediately before activation). Panel (iii) shows the longest sleep bout observed during the baseline night (the night preceding activation) and the activation night (during which the temperature was raised to 31°C), and the longest sleep bout observed during the baseline day and the recovery day. Panel (iv) shows the latency to sleep at night. Panel (v) shows the nighttime and daytime activity index. *p < 0.05, **p < 0.01, ***p < 0.001 by Kruskal–Wallis test with Dunn’s multiple comparison test between the experimental genotype (Mz699>UAS-dTrpA1) and each of the controls. Black asterisks indicate significant comparisons between control flies of the genotype +>UAS-dTrpA1 (n = 43) and experimental flies of the genotype Mz699>UAS-dTrpA1 (n = 30). Blue–gray asterisks indicate significant differences between control flies of the genotype Mz699>+ (n = 37) and experimental flies (Mz699>UAS-dTrpA1).

