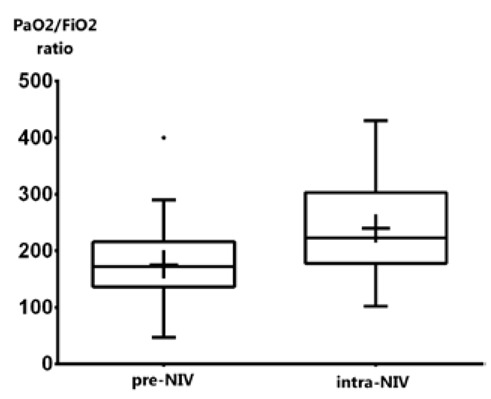
Figure 1.

PaO2/FiO2 mean values before and after one hour of NIV. Box and whisker plot showing PaO2/FiO2 ratio before and after one hour of NIV. The box extend from the 25th to the 75th percentiles; whiskers indicate the minimum and maximum values; plus sign indicate the mean value.
