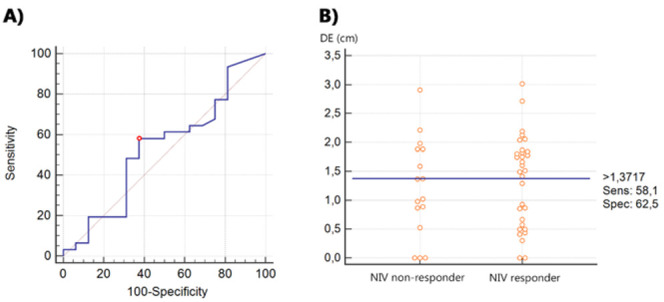
Figure 2.

A) ROC Curve of the proficiency of diaphragm excursion as a predictor of NIV response. B) Dot plot separating NIV-responder and NIV non-responder patients according to their diaphragm excursion. The horizontal line indicates the cut-off point with the best separation (minimal false negative and false positive results) between the two groups. LEGEND: DE, diaphragm excursion;
