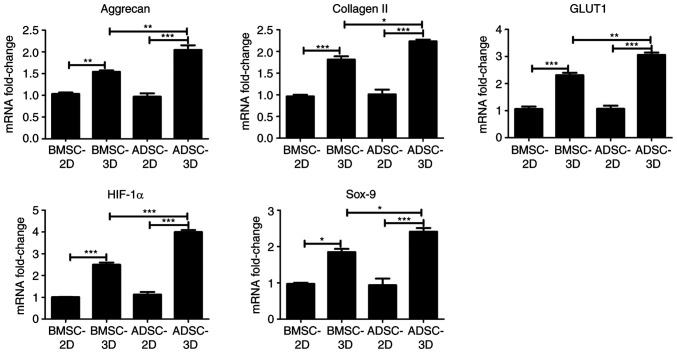
Figure 4.
Gene expression of BMSCs and ADSCs under different culture conditions. The mRNA levels of HIF-1α, GLUT1, Sox-9, aggrecan and type II collagen were determined by reverse transcription-quantitative PCR (n=3). Data were analyzed via one-way ANOVA with Tukey's multiple comparison test. *P<0.05; **P<0.01; ***P<0.001. HIF-1α, hypoxia-inducible factor 1-alpha; GLUT1, glucose transporter 1; BMSC, bone marrow-derived mesenchymal stem cell; ADSCs, adipose-derived mesenchymal stem cell.

