

Abstract
Background:
Population-representative risks of metastatic recurrence are not generally available since cancer registries do not collect data on recurrence. This manuscript presents a novel method that estimates the risk of recurrence using cancer registry disease-specific survival.
Methods:
The method is based on an illness-death process coupled with a mixture-cure model for net cancer survival. The risk of recurrence is inferred from the estimated survival among the non-cured fraction and published data on survival after recurrence. We apply the method to disease-specific survival curves from female breast cancer cases without a prior cancer diagnosis and with complete stage and hormone-receptor (HR) status in Surveillance, Epidemiology and End Results (SEER) registries (1992–2013).
Results:
The risk of recurrence is higher for women diagnosed with breast cancer at older age, earlier period, more advanced stage, and HR-negative tumors. For women diagnosed at ages 60–74 in 2000–2013 the projected percent recurring within 5 years is 2.5%, 9.6% and 34.5% for stages I, II and III HR-positive and 6.5%, 20.2%, and 48.5% for stages I, II and III HR-negative tumors. While HR-positive cases have lower risk of recurrence soon after diagnosis, their risk persists longer than for HR-negative cases. Results show a high degree of robustness to model assumptions.
Conclusions:
The results show that it is possible to extract information about the risk of recurrence using disease-specific survival and the methods can in principle be extended to other cancer sites.
Impact:
This study provides the first population-based summaries of the risk of breast cancer recurrence in US women.
Keywords: Metastasis, Recurrence, Breast cancer, Survival Analysis, Mixture Cure Model
Introduction
Population-based cancer registries data are indispensable in tracking and reporting the evolving burden of cancer in the population. However, they capture information only about the outcomes of diagnosis and death, whether due to the disease or other causes. Given increasing cancer survivorship, there is a growing demand to understand intermediate outcomes reflecting the post-diagnosis course of the disease.
Distant metastatic recurrence is a key outcome in the management of disease at both the individual and the population levels. Recurrence is the return of cancer after primary treatment and reflects progression to a greater disease burden. For nearly all solid tumors, distant metastatic recurrence causes a major shift in the goals of care because cure is no longer possible.
In the absence of population-based information about the risk of recurrence, information has been limited to data reported from clinical trials (1), single-institution patient cohorts (2, 3) and prospective cohorts(4). These data cannot be generalized to the whole population of cancer patients as patients participating in trials represent 4% of the adult cancer population and tend to be younger and healthier (5). Single-institution cohorts usually represent cancer patients being treated at cancer research centers and also do not generalize to the population of patients treated in community settings.
Algorithms utilizing health claims data to infer recurrence have been shown to capture the recurrence event with varying degrees of accuracy (6–8). However, they are less accurate in identifying the timing of recurrence, especially for subgroups of cancer patients who are older or who may not receive treatment immediately after recurrence (9).
Collection of recurrence information is challenging because of the diverse methods and locations at which a recurrence might be diagnosed requiring intensive surveillance over time and ability to access and extract information from medical records. Researchers and the registry community are increasingly interested in identifying ways to leverage existing data, such as electronic medical records, and harnessing informatics methods to capture recurrence events (10). However, it will take years for these efforts to produce the needed information in a population-representative manner.
In this article we present a novel method for extracting information about the risk of recurrence using disease-specific survival curves from cancer registry data. We use the method to produce new estimates of the risk of progressing to metastatic recurrence (recurrence) after being diagnosed with non-metastatic breast cancer. Our approach provides population-based information on the proportion who recurred and the distribution of recurrence times and holds potential for expanding cancer registry reports to provide a more complete picture of the burden of disease and progress on cancer control. Because the methods rely on net cancer survival measures (cause-specific or relative survival)(11) the estimates represent summaries of the risk of metastatic recurrence in the absence of other causes of death and reflect detection and treatment patterns as observed in the population.
Materials and Methods
Overview
We define recurrence as progression to distant metastatic cancer after a diagnosis with cancer at earlier stage with no evidence of metastasis. This definition is broader than the common definition of distant recurrence which requires a disease-free period after initial treatment.
Our approach to estimating the risk of recurrence makes the following assumptions. First, we assume that the disease-specific survival in the study population can be written as a mixture of cured and non-cured (Figure 1) components, where the cured component reflects long-term survivors who ultimately die of another cause. We consider assumptions to estimate the recurrence-free survival from survival among the non-cured. We assume that patients in the non-cured fraction progress through recurrence before dying of cancer, and write their survival time as the sum of the time to recurrence (T1) and the time from recurrence to death (T2) (Figure 1). We use external data on T2 to extract the survival curve for T1 by a method known as deconvolution which assumes that the times T1 and T2 are statistically independent. We finally calculate the probability of progressing to recurrence by combining estimates of the cure fraction and T1. We conduct sensitivity analyses to assess the robustness of our final estimates of the probability of progression to recurrence to model assumptions. We perform simulations to assess robustness of recurrence-free survival estimation to departures in some of the assumptions.
Figure 1.
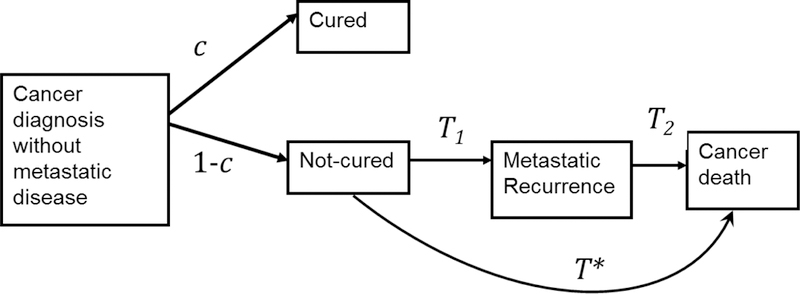
Conceptual model of the diagnosis-recurrence-death pathway showing the key quantities calculated to produce the projections of the risk of recurrence based on cause-specific survival. After cancer diagnosis, a proportion c of patients are not at risk of dying of their cancer (cured) and a proportion 1− c are at risk of dying of their cancer (not cured). Those not cured will have a survival time to cancer death given by T* which can be written as the sum of T1, the time from diagnosis to recurrence and T2, the time from recurrence to cancer death.
The disease-specific survival used as input to the method can be either net relative survival or net cause-specific survival (i.e., representing survival in the absence of other-cause death). All results are similarly interpreted as being in the absence of other-cause death. In the application to breast cancer data we use cause-specific survival.
Mixture cure survival modeling
We use mixture cure survival models (12–17) specified as,
| (A) |
to estimate the cure fraction c and the survival time S* for the non-cured fraction 1 − c, were both c and S* can depend on covariates z. In the application we consider S* following a Weibull and log-logistic parametric survival function however the method could be generalized to other distributions. For simplicity, we will drop the covariates z from the notation.
Analytical deconvolution method: estimating the time from diagnosis to recurrence
Assuming that a recurrence precedes a cancer death, we can write the survival time for the non-cured fraction estimated previously from the cure model, T*, as the sum of the time from diagnosis to recurrence T1 and from recurrence to death T2 (Figure 1). Assuming independence between T1 and T2 we can write the density function of T* as
| (B) |
In the case that T2 is exponential an analytical estimate of f1 exists (18) and we show in the Supplementary Methods and Materials that the survival function of T1 is
| (C) |
In the case that T2 is not exponential we provide in the Supplementary Methods and Materials a numerical solution to Eq. (B).
Estimation of survival from recurrence T2
Solution of Eq. (B) requires an available estimate of the survival from recurrence to death. In the application to breast cancer, survival from recurrence to death is estimated as where is de novo metastatic breast cancer available from registry data and r is cause-specific mortality rate ratio, i.e., a mortality hazard ratio. In our analysis we use a value for r =1.35 from a study comparing de novo versus recurrence metastatic breast cancer survival (2) among women treated at a single institution.
Estimating the risk of recurrence
Once we know S1we can calculate the recurrence-free survival probability at time t, as the probability of being cured or of being in the non-cured group but still being recurrence free,
| (D) |
and the corresponding probability of progressing to recurrence as
| (E) |
The probability of being recurrence free at time t2 given recurrence-free at time t1 is .
Application to breast cancer: SEER registry breast cancer cases
The Surveillance Epidemiology and End Results (SEER) Program collects clinical, demographic, and vital status information on all cancer cases diagnosed in defined geographic areas. Data included in this report are from female breast cancer cases diagnosed in SEER-13 registries (1992–2013) (November 2016 Submission), covering approximately 13% of the US population.
Stage at diagnosis (I–IV) is defined using adjusted American Joint Committee on Cancer (AJCC) 6th edition staging classification(19). We further classify cases by the presence of estrogen receptor (ER) and progesterone receptor (PR). Hormone receptor status positive (HR+) is defined as ER positive or borderline and/or PR positive or borderline. HR− is defined as both ER negative and PR negative. We also present results for local and regional stage at diagnosis using the SEER historic stage.
Disease-specific survival is assessed via net cause-specific survival using the SEER*Stat software (https://seer.cancer.gov/seerstat/). We chose cause-specific survival because early breast cancer relative survival is overestimated due to life tables not representing a healthy screening effect. Because cause of death based on death certificates may have misattribution biases, we use a modified cause-specific death assignment algorithm (20). This algorithm classifies as cancer specific any deaths that are likely to be related to the cancer and accommodates inconsistencies depending on whether the individual has one or multiple cancers (https://seer.cancer.gov/causespecific/).
The study population included women diagnosed with invasive breast cancer between ages 15 and 84 and years 1992–2013 in SEER-13 (N= 546,415). We excluded women diagnosed through death certificate or autopsy (N=1,375), those with zero months of survival (N=409), those with another primary cancer prior to the breast cancer (N= 90,121) and those with missing or unknown stage, ER or PR status (N=70,127). Women diagnosed with another cancer prior to the breast cancer are excluded because of difficulties in ascertaining their cause of death. The final study cohort included 381,430 women. We estimate cause-specific survival for each combination of stage, HR status, period (1992–1999, and 2000–2013) and grouped age (15–59, 60–74, 75–84) all measured at diagnosis. The number of women included in each group is displayed in Table 1. We use the CanSurv software (https://surveillance.cancer.gov/cansurv/) (12) to fit the Log-logistic and Weibull mixture cure survival models to the survival data for breast cancer cases stratified by stage and HR status (I/HR+, I/HR-, II/HR+, II/HR-, III/HR+, III/HR-) and age group. Period of diagnosis is entered as a predictor for the cure fraction and survival for those not cured.
Table 1.
Number of cases for the different groupings and breast cancer cause-specific survival (CS) and respective standard errors (S.E.) by stage, age, period and hormonal recetor (HR) status at diagnosis in percent. Number of cases N for time from diagnosis equal 5 and 10 years represent respectively, the number of cases at diagnosis and the number of cases alive after 9 years from diagnosis.
| HR positive |
HR negative |
||||||||||||
|---|---|---|---|---|---|---|---|---|---|---|---|---|---|
| 1992–1999 | 2000–2013 | 1992–1999 | 2000–2013 | ||||||||||
| Stage/Age | Time from diag. | N | CS (%) | SE (%) | N | CS (%) | SE (%) | N | CS (%) | SE (%) | N | CS (%) | SE (%) |
| I/15–59 | 5 | 19,616 | 98.3 | 0.1 | 37,281 | 99.1 | 0.0 | 4,894 | 93.2 | 0.4 | 7,348 | 95.0 | 0.2 |
| 10 | 18,115 | 95.3 | 0.2 | 18,179 | 97.2 | 0.1 | 4,196 | 89.0 | 0.5 | 3,795 | 91.9 | 0.3 | |
| I/60–74 | 5 | 18,313 | 98.0 | 0.1 | 29,399 | 98.7 | 0.1 | 2,701 | 93.5 | 0.5 | 3,932 | 95.4 | 0.3 |
| 10 | 14,877 | 94.5 | 0.2 | 12,939 | 96.5 | 0.1 | 2,055 | 88.9 | 0.6 | 1,738 | 92.1 | 0.5 | |
| I/75–84 | 5 | 7,748 | 96.4 | 0.2 | 11,650 | 97.2 | 0.1 | 895 | 92.0 | 0.9 | 1,220 | 90.7 | 0.8 |
| 10 | 4,429 | 91.1 | 0.4 | 4,358 | 92.8 | 0.3 | 501 | 85.7 | 1.3 | 402 | 82.6 | 1.3 | |
| II/15–59 | 5 | 14,993 | 93.2 | 0.2 | 29,057 | 95.8 | 0.1 | 6,208 | 81.4 | 0.5 | 9,254 | 86.0 | 0.3 |
| 10 | 12,399 | 85.3 | 0.3 | 13,257 | 89.6 | 0.2 | 4,514 | 75.8 | 0.5 | 4,427 | 81.5 | 0.4 | |
| II/60–74 | 5 | 9,220 | 92.5 | 0.3 | 15,145 | 95.0 | 0.2 | 2,137 | 79.8 | 0.9 | 3,171 | 84.0 | 0.6 |
| 10 | 6,493 | 83.8 | 0.4 | 6,151 | 88.0 | 0.3 | 1,267 | 72.4 | 1.0 | 1,318 | 77.9 | 0.7 | |
| II/75–84 | 5 | 4,318 | 90.1 | 0.5 | 5,669 | 90.3 | 0.4 | 781 | 71.7 | 1.7 | 933 | 74.8 | 1.1 |
| 10 | 1,930 | 79.4 | 0.7 | 1,815 | 80.4 | 0.6 | 288 | 64.3 | 1.9 | 302 | 66.7 | 1.5 | |
| III/15–59 | 5 | 6,930 | 76.7 | 0.5 | 10,051 | 83.6 | 0.3 | 3,054 | 51.6 | 0.9 | 2,919 | 59.4 | 0.7 |
| 10 | 4,054 | 59.6 | 0.6 | 3,919 | 67.6 | 0.5 | 1,283 | 44.3 | 0.9 | 1,231 | 51.7 | 0.8 | |
| III/60–74 | 5 | 3,741 | 72.4 | 0.8 | 4,127 | 80.5 | 0.5 | 1,116 | 48.8 | 1.5 | 996 | 59.5 | 1.1 |
| 10 | 1,668 | 53.7 | 0.9 | 1,383 | 65.1 | 0.8 | 374 | 39.2 | 1.5 | 369 | 50.5 | 1.3 | |
| III/75–84 | 5 | 1,657 | 67.7 | 1.2 | 1,372 | 69.2 | 1.0 | 420 | 39.2 | 2.5 | 285 | 45.6 | 1.9 |
| 10 | 445 | 49.0 | 1.5 | 365 | 51.4 | 1.4 | 69 | 26.7 | 2.4 | 74 | 35.1 | 2.2 | |
| IV/15–59 | 5 | 1,245 | 29.9 | 1.3 | 1,277 | 36.6 | 0.8 | 494 | 13.8 | 1.6 | 241 | 19.2 | 1.1 |
| 10 | 166 | 13.3 | 1.0 | 208 | 16.1 | 0.9 | 44 | 10.1 | 1.4 | 63 | 13.1 | 1.1 | |
| IV/60–74 | 5 | 1,127 | 23.3 | 1.3 | 714 | 30.1 | 1.0 | 327 | 7.2 | 1.5 | 98 | 13.7 | 1.3 |
| 10 | 101 | 10.7 | 1.0 | 104 | 12.6 | 0.9 | 12 | 4.4 | 1.2 | 19 | 9.7 | 1.4 | |
| IV/75–84 | 5 | 550 | 21.8 | 1.9 | 234 | 21.7 | 1.4 | 149 | 8.3 | 2.4 | 23 | 8.7 | 1.8 |
| 10 | 33 | 11.1 | 1.7 | 28 | 7.9 | 1.3 | 5 | 5.3 | 2.1 | 7 | 5.4 | 1.8 | |
To estimate the survival from recurrence, T2, we use as the base survival the cause-specific survival for women diagnosed with de novo stage IV breast cancer in the SEER-13 areas, stratified by grouped calendar year at diagnosis (1992–1999 and 2000–2013), age at diagnosis (15–59, 60–74, 75–84) and HR status. We estimate r =1.35 using published results from a study comparing de novo vs recurrence metastatic breast cancer survival from an institutional cohort of breast cancer patients (2).
Sensitivity analyses and simulation studies to interrogate robustness of results to key model assumptions.
Sensitivity analyses addressed the assumption of cure, distributional assumptions within the cure model, and the assumed value of the hazard ratio r. We considered two different distributions for survival of the non-cured fraction, namely Weibull and log-logistic. To assess the assumption of cure we fitted a log-logistic survival without cure to stage III breast cancer cause-specific survival and applied the deconvolution method to the fitted survival. To evaluate the impact of the adjustment factor r we provide results for a range of r values from 1.0 to 1.7. We developed a non-parametric deconvolution method that did not assume an exponential distribution for T2 and used simulations to explore the impact of the assumption of independence between T1and T2. We also used simulation to explore the impact of misspecifications of the survival distribution for T2. Simulations and their results are fully described in the Supplementary Methods and Materials. Simulations parameters are displayed in Supplementary Table 1.
Results
Breast cancer survival and fit to the mixture cure models
The observed 5- and 10-year breast cancer survival is higher for women diagnosed in the most recent period, at younger ages, less advanced stage and HR+ tumors (Table 1). Observed de novo stage IV breast cancer survival is higher in the most recent period, younger ages and ER+. The mixture log-logistic cure models fit well the observed data (Figure 2) especially for younger women diagnosed at ages 15–59 and 60–74. For the older age group and stages II and III, in which there are a small number of cases and more variability in observed breast cancer survival, the model fit well up to 15 years.
Figure 2.

Observed cause-specific survival (points) and fitted log-logistic mixture cure survival model (lines) for women diagnosed with breast cancer in the SEER-13 areas by stage at diagnosis, hormone receptor status (HR) and period at diagnosis. The last row of figures represent the observed cause-specific survival for de novo stage IV breast cancer.
Projected percent recurring within specified intervals from diagnosis
Table 2 reports risk of recurrence estimates together with 95% confidence intervals by stage, HR status, age and calendar year at diagnosis. Risks of recurrence within 5, 10 or 15 years are lower in more recent diagnosis years and for cases with less advanced disease, HR+ tumors and younger age at diagnosis. For women diagnosed at age 60–74 in 2000–2013 the percent recurring within 5 years is 2.5%, 9.6% and 34.5% for stages I, II and III HR+ tumors and 6.5%, 20.2%, and 48.5% for stages I, II and III HR− tumors, respectively. Aggregating the data for all stages and all HR status, our most contemporary estimates suggest that 20 percent of women diagnosed with stage I-III breast cancer will progress to metastatic breast cancer within 20 years of diagnosis (Supplementary Table 3).
Table 2.
Estimated percent progressing to metastatic recurrence within 5, 10 or 15 years and respective 95% confidence intervals (CI) in parenthesis by stage, hormone receptor (HR) status, age and years at diagnosis. The results used the analytical deconvolution method and the log-logistic cure mixture model and represent probabilities in the absence of other causes of death. Survival from recurrence used an adjustment of hazard ration r=1.35 compared to de novo distant-stage breast cancer. Estimates using historical stage for women diagnosed with breast cancer in 2000–2013 are also presented.
| Fraction recurrring in percent (95% confidence interval) | ||||||||
|---|---|---|---|---|---|---|---|---|
| Stage | Year at diagnosis | Years from diagnosis | Age: 15–59 | HR positive 60–74 | 75–84 | 15–59 | HR negative 60–74 | 75–84 |
| I | 1992–99 | 5 | 3.4 (3.2, 3.7) | 3.7 (3.4, 3.9) | 6.8 (6.0, 7.5) | 8.7 (7.9, 9.6) | 7.3 (6.5, 8.1) | 12.5 (10.8, 14.2) |
| 10 | 6.6 (6.3, 7.0) | 7.6 (7.2, 8.0) | 13.2 (12.4, 14.0) | 12.3 (11.5, 13.1) | 12.2 (11.2, 13.2) | 19.8 (17.7, 21.8) | ||
| 15 | 9.5 (9.0, 9.9) | 11.3 (10.8, 11.8) | 18.6 (17.3, 19.8) | 13.9 (13.0, 14.8) | 14.6 (13.5, 15.8) | 23.1 (20.5, 25.6) | ||
| I | 2000–13 | 5 | 2.3 (2.1, 2.4) | 2.5 (2.4, 2.7) | 4.5 (4.2, 4.8) | 7.2 (6.6, 7.8) | 6.5 (5.9, 7.2) | 10.3 (9.0, 11.6) |
| 10 | 4.4 (4.1, 4.6) | 5.2 (4.9, 5.5) | 9.0 (8.4, 9.5) | 9.4 (8.7, 10.1) | 9.7 (8.9, 10.6) | 15.6 (13.8, 17.4) | ||
| 15 | 6.2 (5.6, 6.8) | 7.8 (7.2, 8.4) | 12.9 (11.8, 13.9) | 10.4 (9.6, 11.2) | 11.2 (10.1, 12.3) | 17.9 (15.6, 20.1) | ||
| II | 1992–99 | 5 | 12.4 (11.7, 13.0) | 12.6 (11.8, 13.3) | 19.4 (18.2, 20.7) | 23.0 (21.6, 24.3) | 24.1 (22.7, 25.5) | 35.0 (32.7, 37.4) |
| 10 | 19.9 (19.2, 20.6) | 21.5 (20.6, 22.3) | 28.6 (27.2, 30.0) | 26.3 (25.3, 27.4) | 30.2 (28.7, 31.6) | 40.7 (38.1, 43.2) | ||
| 15 | 24.6 (23.9, 25.3) | 27.4 (26.5, 28.3) | 33.5 (31.7, 35.3) | 27.6 (26.5, 28.6) | 32.1 (30.5, 33.7) | 42.3 (39.6, 45.0) | ||
| II | 2000–13 | 5 | 9.3 (8.9, 9.7) | 9.6 (9.2, 10.1) | 14.1 (13.3, 14.9) | 18.2 (17.2, 19.1) | 20.2 (19.0, 21.4) | 28.1 (26.1, 30.1) |
| 10 | 15.1 (14.6, 15.6) | 16.6 (16.0, 17.2) | 21.8 (20.7, 22.9) | 19.9 (19.2, 20.7) | 23.5 (22.2, 24.7) | 32.2 (30.0, 34.5) | ||
| 15 | 18.8 (17.9, 19.7) | 21.4 (20.4, 22.4) | 26.1 (24.4, 27.7) | 20.7 (19.9, 21.5) | 24.6 (23.3, 26.0) | 33.4 (31.0, 35.8) | ||
| III | 1992–99 | 5 | 40.7 (39.0, 42.5) | 42.5 (40.7, 44.4) | 53.3 (50.7, 55.8) | 56.4 (54.3, 58.5) | 55.2 (53.1, 57.4) | 68.3 (65.5, 71.2) |
| 10 | 50.3 (49.0, 51.5) | 54.3 (52.8, 55.7) | 61.5 (59.2, 63.7) | 59.0 (57.3, 60.6) | 61.1 (59.0, 63.3) | 73.6 (70.7, 76.5) | ||
| 15 | 54.7 (53.5, 55.9) | 59.8 (58.2, 61.3) | 65.2 (62.7, 67.8) | 60.1 (58.5, 61.7) | 62.8 (60.6, 65.1) | 75.1 (72.1, 78.0) | ||
| III | 2000–13 | 5 | 32.1 (31.1, 33.2) | 34.5 (33.1, 35.8) | 42.3 (40.3, 44.4) | 47.8 (46.1, 49.6) | 48.5 (46.4, 50.7) | 60.6 (57.5, 63.8) |
| 10 | 41.1 (39.9, 42.3) | 45.5 (43.9, 47.0) | 51.8 (49.4, 54.1) | 49.2 (47.7, 50.6) | 51.9 (49.7, 54.0) | 65.4 (62.1, 68.8) | ||
| 15 | 45.3 (43.7, 46.8) | 50.7 (48.7, 52.8) | 56.0 (53.2, 58.8) | 50.0 (48.5, 51.5) | 53.1 (50.8, 55.4) | 66.8 (63.3, 70.3) | ||
| Historical Stage |
Local |
Regional |
||||||
| 2000–13 | 5 | 6.1 (5.8, 6.4) | 5.3 (5.0, 5.5) | 7.7 (7.3, 8.2) | 23.1 (22.2, 24.1) | 21.6 (20.7, 22.5) | 26.6 (25.4, 27.9) | |
Table 3 shows the percent recurring within the next 5 years conditional on being alive and recurrence-free at 0, 5 and 10 years from diagnosis. In general, the risk is higher in the first 5 years after diagnosis and lower among women who are recurrence free at 5 and 10 years after diagnosis. In later intervals the risk declines most for HR− tumors stages II and III. For example, for women diagnosed in (2000–2013) at ages 60–74 with stage II HR− breast cancer, the fraction recurring in the next 5 years given recurrence free at 0, 5 and 10 years from diagnosis are, respectively 20.2%, 4.1% and 1.2%. The clear exception is stage I HR+, for which conditional probabilities of recurring do not change, and even slightly increase, with survival time.
Table 3.
Conditional probabilities of progressing to metastatic recurrence in the absence of other cause death in an interval given being alive and recurrence free at the beginning of interval by stage, hormone receptor (HR) status, grouped age and years at diagosis.
| Percent progressing to MR among women recurrence-free at the beginning of the interval | |||||||
|---|---|---|---|---|---|---|---|
| HR positive |
HR negative |
||||||
| Stage I | Years from diag. | 15–59 | 60–74 | 75–84 | 15–59 | 60–74 | 75–84 |
| 1992–1999 | 0 to 5 | 3.4% | 3.7% | 6.8% | 8.7% | 7.3% | 12.5% |
| 5 to 10 | 3.3% | 4.1% | 6.9% | 3.9% | 5.3% | 8.3% | |
| 10 to 15 | 3.0% | 4.1% | 6.2% | 1.8% | 2.8% | 4.1% | |
| 2000–2013 | 0 to 5 | 2.3% | 2.5% | 4.5% | 7.2% | 6.5% | 10.3% |
| 5 to 10 | 2.1% | 2.7% | 4.7% | 2.4% | 3.4% | 5.9% | |
| 10 to 15 | 1.9% | 2.7% | 4.3% | 1.1% | 1.6% | 2.7% | |
| Stage II | |||||||
| 1992–1999 | 0 to 5 | 12.4% | 12.6% | 19.4% | 23.0% | 24.1% | 35.0% |
| 5 to 10 | 8.6% | 10.2% | 11.4% | 4.4% | 8.0% | 8.7% | |
| 10 to 15 | 5.9% | 7.6% | 6.9% | 1.7% | 2.8% | 2.8% | |
| 2000–2013 | 0 to 5 | 9.3% | 9.6% | 14.1% | 18.2% | 20.2% | 28.1% |
| 5 to 10 | 6.4% | 7.7% | 8.9% | 2.2% | 4.1% | 5.7% | |
| 10 to 15 | 4.4% | 5.7% | 5.5% | 0.9% | 1.5% | 1.7% | |
| Stage III | |||||||
| 1992–1999 | 0 to 5 | 40.7% | 42.5% | 53.3% | 56.4% | 55.2% | 68.3% |
| 5 to 10 | 16.1% | 20.4% | 17.5% | 5.9% | 13.1% | 16.6% | |
| 10 to 15 | 8.9% | 12.0% | 9.8% | 2.8% | 4.5% | 5.5% | |
| 2000–2013 | 0 to 5 | 32.1% | 34.5% | 42.3% | 47.8% | 48.5% | 60.6% |
| 5 to 10 | 13.2% | 16.8% | 16.3% | 2.6% | 6.4% | 12.2% | |
| 10 to 15 | 7.1% | 9.7% | 8.7% | 1.7% | 2.5% | 3.9% | |
Note: The results used the analytical deconvolution method and the log-logistic cure mixture model. Survival from recurrence used an adjustment of hazard ration r=1.35 compared to de novo distant-stage breast cancer.
Sensitivity analyses.
The estimated risk of recurrence is robust to the adjustment factor r used to estimate the survival from recurrence (Table 4A). The greatest sensitivity to this factor was observed for stage III/HR+ tumors. Smaller differences for different adjustment factors were observed for HR− tumors and longer intervals after diagnosis.
Table 4.
Sensitivity of estimated percent progressing to metastatic recurrence to (A) the adjustment hazard ratio r, (B) the numerical and analytical solution using log-logistic and Weibull mixture cure survival models and r =1.35 and (C) the assumption of no cure for women diagnosed with stage III breast cancer. Results are shown for women diagnosed at ages 60–74 years.
| Percent progressing to
recurrence |
|||||||||
|---|---|---|---|---|---|---|---|---|---|
| A. Sensitivity to the adjustment r of the de novo stage IV breast cancer survival | |||||||||
| HR positive |
HR negative |
||||||||
| Years from diag. | r=1.0 | r=1.35 | r=1.5 | r=1.7 | r=1.0 | r=1.35 | r=1.5 | r=1.7 | |
| Stage I | 5 | 3.0% | 2.5% | 2.4% | 2.3% | 7.2% | 6.5% | 6.3% | 6.1% |
| 10 | 5.8% | 5.2% | 5.0% | 4.9% | 10.1% | 9.7% | 9.6% | 9.5% | |
| 15 | 8.3% | 7.8% | 7.6% | 7.4% | 11.4% | 11.2% | 11.2% | 11.1% | |
| Stage II | 5 | 11.3% | 9.6% | 9.2% | 8.7% | 21.7% | 20.2% | 19.8% | 19.4% |
| 10 | 18.1% | 16.6% | 16.2% | 15.7% | 23.8% | 23.5% | 23.4% | 23.3% | |
| 15 | 22.5% | 21.4% | 21.1% | 20.7% | 24.7% | 24.6% | 24.6% | 24.5% | |
| Stage III | 5 | 39.6% | 34.5% | 33.0% | 31.4% | 50.8% | 48.5% | 47.9% | 47.2% |
| 10 | 48.3% | 45.5% | 44.7% | 43.8% | 52.3% | 51.9% | 51.7% | 51.6% | |
| 15 | 52.2% | 50.7% | 50.3% | 49.9% | 53.2% | 53.1% | 53.0% | 53.0% | |
|
B. Sensitivity to
log-logistic vs. Weibull assumption | |||||||||
| HR positive |
HR negative |
||||||||
| Cure Log-logistic |
Cure Weibull |
Cure Log-logistic |
Cure Weibull |
||||||
| Years from diag | Analytical | Numerical | Analytical | Numerical | Analytical | Numerical | Analytical | Numerical | |
| Stage I | Cure | 65% | n.a. | 81% | 83% | ||||
| 1992–1999 | 5 | 3.7% | 3.0% | n.a. | n.a. | 7.3% | 6.6% | 6.5% | 5.9% |
| 10 | 7.6% | 6.9% | n.a. | n.a. | 12.2% | 12.0% | 11.7% | 11.4% | |
| Stage I | Cure | 75% | n.a. | 86% | 88% | ||||
| 2000–2013 | 5 | 2.5% | 2.2% | n.a. | n.a. | 6.5% | 5.8% | 6.3% | 5.6% |
| 10 | 5.2% | 4.9% | n.a. | n.a. | 9.7% | 9.7% | 9.8% | 9.7% | |
| Stage II | Cure | 56% | 65% | 66% | 67% | ||||
| 1992–1999 | 5 | 12.6% | 10.6% | 12.0% | 10.1% | 24.1% | 22.8% | 21.4% | 19.9% |
| 10 | 21.5% | 20.3% | 21.3% | 20.0% | 30.2% | 30.3% | 30.1% | 30.0% | |
| Stage II | Cure | 64% | 74% | 74% | 75% | ||||
| 2000–2013 | 5 | 9.6% | 8.6% | 9.5% | 8.5% | 20.2% | 19.3% | 19.7% | 18.5% |
| 10 | 16.6% | 16.0% | 16.6% | 16.0% | 23.5% | 24.1% | 23.8% | 24.5% | |
| Stage III | Cure | 29% | 37% | 35% | 37% | ||||
| 1992–1999 | 5 | 42.5% | 38.0% | 39.8% | 34.9% | 55.2% | 54.4% | 52.9% | 51.0% |
| 10 | 54.3% | 53.6% | 55.1% | 53.9% | 61.1% | 61.7% | 61.9% | 62.5% | |
| Stage III | Cure | 38% | 48% | 45% | 47% | ||||
| 2000–2013 | 5 | 34.5% | 32.0% | 33.4% | 30.9% | 48.5% | 48.4% | 48.5% | 47.5% |
| 10 | 45.5% | 45.1% | 45.9% | 45.5% | 51.9% | 53.7% | 52.4% | 52.7% | |
|
C. Sensitivity to the
cure assumption: log-logistic with no cure
(cure=0%) | |||||||||
| Stage III | No cure
log-logistic |
No cure
log-logistic |
|||||||
| Analytical | Numerical | Analytical | Numerical | ||||||
| 1992–1999 | 5 | 40.0% | 35.7% | 49.7% | 48.0% | ||||
| 10 | 55.5% | 53.9% | 63.9% | 63.6% | |||||
| 2000–2013 | 5 | 30.8% | 28.4% | 45.1% | 43.2% | ||||
| 10 | 45.4% | 44.5% | 58.3% | 58.8% | |||||
Even though the cure fraction differed between the log-logistic and Weibull models, the risk of progressing to recurrence was very similar irrespective of the cure model used (Table 4B). For example, the cure fraction estimates were 64% vs 74 % for stage II ER+ breast cancer in 2000–2013 using log-logistic and Weibull, respectively, and the estimated recurrence probabilities were 16.6% in both cases. The table also shows that the analytical deconvolution method which assumed an exponential distribution T2 produced similar results to the numerical deconvolution method. Estimates varied more in the initial years (up to 5 years) after diagnosis.
When we did not specify a cure model and applied the deconvolution method directly to a log-logistic survival without cure, fitted to the net cause-specific survival, we found modest absolute differences (still smaller than 6.5%) in the percent recurring at ten years (Table 4C). The largest differences were for women diagnosed with stage III ER- tumors in 2000–2013, where 51.9% progressed to recurrence after 10 years under the cure model versus 59.3% assuming no cure. For ER+ tumors the differences were smaller (less than 4%) when we assumed no cure.
Simulations results (Supplementary Table 2) showed that estimates assuming independence between the times from diagnosis to recurrence and from recurrence to death were robust to generated data that departed from these assumptions. The largest biases occurred when S2 was misspecified with a much lower median survival compared with the true distribution of T2.
Discussion
Although US cancer registries play a vital role in tracking the population incidence of cancer, they are generally limited in their ability to capture post-diagnosis events other than mortality. This article provides a blueprint for a method that uses existing data to overcome this deficiency and a demonstration of its value in estimating the risk of metastatic breast cancer recurrence.
Model assumptions and robustness.
The key assumptions of the method are: (1) A cure model is appropriate for net disease-specific survival among cases that are not metastatic at diagnosis; (2) the time from metastatic recurrence to death is exponential if the analytical method is used (the numerical method does not require the assumption); (3) the survival hazard after metastatic recurrence is a known multiple r of the survival from de novo metastatic diagnosis; and (4) time from diagnosis to recurrence does not influence the time from recurrence to death.
The method uses a cure model for net cancer survival. Cure fraction estimates and their interpretation as cure are problematic when risk of cancer death (or excess mortality in the case of relative survival) persist over the long term (15) (20). In these situations, cure models may not converge, and if they do, different cure models often yield different estimates for the cure fraction. We found that the log-logistic model provided a better fit to the observed data and converged in all settings while the Weibull did not converge for stage I HR+ breast cancer survival. However, when both models converged and cure fraction estimates differed, the estimated recurrence probabilities were ultimately very similar. The projected probability of recurrence is robust within the observed follow-up time, probably because it mimics the functional form of the mixture cure model [c+(1−c) S*] that fits the observed data. Furthermore, sensitivity analyses assuming no cure for stage III breast cancer showed that the estimates of the risk of recurrence were only modestly different from the estimates assuming a cure model. In principle, if excess mortality persists over the long term and the notion of cure is not applicable the deconvolution method can be applied to disease-specific survival without cure. However, if the cure model fits the data well at the end of follow-up and provides a non-trivial cure probability, as in our application, we would recommend it be used.
Our main results use an analytical approach to extract the recurrence-free survival from the non-cured survival distribution, which assumes an exponential distribution for the time from recurrence to death. However, results are similar under a flexible, smooth distribution (numerical approach). Furthermore, simulations using data generated from a non-exponential distribution for the time from recurrence showed the estimates of the recurrence-free survival to be robust, so long as the median time from recurrence is relatively close to the true median value.
We use a mortality hazard ratio r =1.35 (2) to relate the survival from recurrence to the survival from de novo metastatic diagnosis. A factor higher than 1 represents poorer survival from recurrence compared to survival from de novo metastatic diagnosis and accounts for greater susceptibility to the cancer as well as greater vulnerability to treatment morbidities due to accumulation of cancer treatments. In principle, this hazard ratio may vary by patient factors such as age at diagnosis and hormone receptor status. Further studies are needed to more comprehensively establish how de novo metastatic survival relates to recurrent metastatic survival. We find that our results are very robust across a wide range of plausible adjustment values, from r=1.35 to r=1.7.
Our method can account for some association between time to recurrence and time from recurrence to death by stratifying survival and analyses. We stratified by age, stage, period and HR status in our application. Within each stratum there may be residual association between the times from diagnosis to recurrence and from recurrence to death. Simulations incorporating this association have shown that it does not materially affect results (see Supplementary Table 2).
Application to breast cancer.
Our results provide novel insights into how the risk of recurrence varies with breast cancer stage, HR status, age, year of diagnosis and time since diagnosis. Since we require at least ten years of follow-up for our analysis we were not able to examine recurrence risk by human epidermal growth factor receptor (HER2) status which has only been collected by SEER since 2010. In addition, adjuvant treatment information in the SEER data is incomplete and could not be incorporated in the estimates. Thus, the estimates reflect the risk of recurrence under observed patterns of care.
Some broad trends are immediately apparent. These include a decline in the risk of recurrence in the more recent time period, a trend towards a worse risk in older cases, and a higher risk of recurrence among HR− cases soon after diagnosis that rapidly declines thereafter. Further, while HR+ cases have lower risk of recurrence soon after diagnosis, their risk persists for longer than is the case for HR− cases. The patterns are similar to those observed in two Canadian cohorts diagnosed from 1992–2002 and 2004–2008 respectively (4).
It is likely that decreased risk for more recent diagnoses reflects the benefits of novel targeted treatments such as taxanes (21), aromatase inhibitors (22) and a dose-dense chemotherapy schedule (23), since screening and adjuvant chemotherapy had largely disseminated in the US population by the end of the 1980s (24) (25). A major development in 2005 was the rapid adoption of trastuzumab for early-stage HER2-positive breast cancer (26–28). Although we could not include HER2 status as a predictor in this analysis due to lack of measurement in the registry until recently, HER2-targeted therapy likely contributed to the decline in recurrence that we observed in the later interval. We do not expect screening to have played a role in the observed trends with year of diagnosis since mammography screening had more or less fully disseminated within the US population by the start of the diagnosis period considered.
Increases in the risk of recurrence among older women are consistent with reduced use of systemic chemotherapies as patients age (25). Results from an international study also show that the risk of breast cancer recurrence increases with age for patients included in the Tamoxifen Exemestane Adjuvant Multinational (TEAM) Trial (29).
Our observation that the risk of recurrence declines sharply over time since diagnosis for women with HR− tumors is consistent with results from other studies that show the hazard of breast cancer mortality is initially higher for HR− cases but drops below that of HR+ cases 3 to 5 years after diagnosis (4, 30–33). Although women with stage I HR+ tumors have very low risk of recurrence, their risk remains somewhat constant even after remaining recurrence-free 5 or 10 years after diagnosis.
The cause of the observed differences in recurrence patterns by HR status is not fully understood. One possible explanation is a cure/no cure distribution of HR− breast tumors, with some HR− cancers being cured by adjuvant chemotherapy (and thus never recurring) while the remainder recur quickly due to their aggressive biology(34). The reasons for differential response to chemotherapy are a subject of intense study, and part of the answer may lie in genetic susceptibility. Studies have reported superior response to chemotherapy among HR− cancers in BRCA1/2 mutation carriers(35, 36) and these findings might extend to other newly recognized causes of genetic susceptibility to HR− breast cancer (37). With HR+ breast cancer, the persistent risk of recurrence more than a decade after diagnosis has prompted trials of extended adjuvant endocrine therapy, with some showing modest benefits (38, 39) and others yielding less conclusive findings (40–42). A possible explanation is that endocrine therapy may act to delay recurrence in many HR+ tumors, rather than achieving a cure.
Our results are quite consistent with international studies that routinely collect recurrence information for their national registries. A study in the Munich Cancer Register reported a 5-year breast cancer recurrence risk of 10% for 18 592 patients with no distant metastases at diagnosis between 1995 and 2003(43). Data from cancer registry of non-metastatic breast cancer cases in Australia (44) estimated that the risk of developing a distant recurrence within 5 years was 5.3% (95% CI, 4.6%–6.0%) for women with localized node-negative disease and 18.1% (95% CI, 16.7%–19.7%) for women with regional breast cancer. Our estimates are slightly higher compared to the Australian registry results: The probabilities of progressing to recurrence within 5 years range from 6.1% to 7.7% for localized and 21.6% to 26.6% for regional breast cancer, respectively, depending on age at diagnosis (Table 2). This is consistent with the exclusion of women progressing to metastatic breast cancer within 120 days of diagnosis in the Australian study.
Our estimates use net cancer-specific survival and represent net risk of metastatic recurrence in the absence of other-cause death. Because they isolate the effect of cancer on survival by removing the effects of competing mortality, they are useful as cancer control measures for tracking progress against cancer over time or for comparisons across groups of patients. They are limited to risk groups reflected by patient and disease characteristics routinely captured by cancer registries, and reflect patterns of post-diagnosis surveillance and treatment as observed at the population level. These results are highly relevant to the great majority of U.S. cancer patients who are treated in the community setting, but they are not designed to be used for individual treatment decision making. Because our estimates do not include the chances of dying of other causes they are less useful for individualized predictions and clinical decision making; future work will develop probabilities of recurrence under competing risks.
In conclusion, there is an urgent need for population-representative estimates of cancer recurrence risks. Our results are the first developed for the US population and are likely to add materially to the information currently provided by registry data. We anticipate that the approach will be applicable to other cancers, in particular those amenable to mixture-cure modeling, enhancing our understanding of the burden of cancer in the population.
Supplementary Material
Acknowledgments
Financial support: This work was supported by the National Cancer Institute at the National Institutes of Health. The content is solely the responsibility of the authors and does not necessarily represent the official views of the National Cancer Institute or the National Institutes of Health.
Footnotes
Conflict of interest: The authors declare no potential conflicts of interest.
References
- 1.Tevaarwerk AJ, Gray RJ, Schneider BP, Smith ML, Wagner LI, Fetting JH, et al. Survival in patients with metastatic recurrent breast cancer after adjuvant chemotherapy Little Evidence of Improvement Over the Past 30 Years. Cancer 2013;119(6):1140–8. [DOI] [PMC free article] [PubMed] [Google Scholar]
- 2.Dawood S, Broglio K, Ensor J, Hortobagyi GN, Giordano SH. Survival differences among women with de novo stage IV and relapsed breast cancer. Ann Oncol 2010;21(11):2169–74. [DOI] [PMC free article] [PubMed] [Google Scholar]
- 3.Radosa JC, Eaton A, Stempel M, Khander A, Liedtke C, Solomayer EF, et al. Evaluation of local and distant recurrences pattern in patients with triple negative breast cancer according to age. Ann Surg Oncol 2017;24(3):698–704. [DOI] [PMC free article] [PubMed] [Google Scholar]
- 4.Cossetti RJ, Tyldesley SK, Speers CH, Zheng Y, Gelmon KA. Comparison of breast cancer recurrence and outcome patterns between patients treated from 1986 to 1992 and from 2004 to 2008. J Clin Oncol 2015;33(1):65–73. [DOI] [PubMed] [Google Scholar]
- 5.Institute of Medicine. Transforming Clinical Research in the United States: Challenges and Opportunities: Workshop Summary National Academy Press, Washington DC; 2010. [PubMed] [Google Scholar]
- 6.Hassett MJ, Ritzwoller DP, Taback N, Carroll N, Cronin AM, Ting GV, et al. Validating billing/encounter codes as indicators of lung, colorectal, breast, and prostate cancer recurrence using 2 large contemporary cohorts. Med Care 2014;52(10):e65–73. [DOI] [PMC free article] [PubMed] [Google Scholar]
- 7.Hassett MJ, Uno H, Cronin AM, Carroll NM, Hornbrook MC, Ritzwoller D. Detecting Lung and Colorectal Cancer Recurrence Using Structured Clinical/Administrative Data to Enable Outcomes Research and Population Health Management. Med Care 2017;55(12):E88–E98. [DOI] [PMC free article] [PubMed] [Google Scholar]
- 8.Chubak J, Yu O, Pocobelli G, Lamerato L, Webster J, Prout MN, et al. Administrative data algorithms to identify second breast cancer events following early-stage invasive breast cancer. J Natl Cancer Inst 2012;104(12):931–40. [DOI] [PMC free article] [PubMed] [Google Scholar]
- 9.Warren JL, Mariotto A, Melbert D, Schrag D, Doria-Rose P, Penson DF, et al. Sensitivity of Medicare claims to identify cancer recurrence in elderly colorectal and breast cancer patients. Medical Care 2016;54(8):E47–E54. [DOI] [PMC free article] [PubMed] [Google Scholar]
- 10.Warren JL, Yabroff KR. Challenges and opportunities in measuring cancer recurrence in the United States. J Natl Cancer Inst 2015;107(8). [DOI] [PMC free article] [PubMed] [Google Scholar]
- 11.Mariotto AB, Noone AM, Howlader N, Cho H, Keel GE, Garshell J, et al. Cancer survival: an overview of measures, uses, and interpretation. J Natl Cancer Inst Monogr 2014;2014(49):145–86. [DOI] [PMC free article] [PubMed] [Google Scholar]
- 12.Yu B, Tiwari RC, Cronin KA, McDonald C, Feuer EJ. CANSURV: A Windows program for population-based cancer survival analysis. Comput.Methods Programs Biomed 2005;80(3):195–203. [DOI] [PubMed] [Google Scholar]
- 13.Yu B, Tiwari RC, Cronin KA, Feuer EJ. Cure fraction estimation from the mixture cure models for grouped survival data. Stat.Med 2004;23(11):1733–47. [DOI] [PubMed] [Google Scholar]
- 14.De Angelis R, Capocaccia R, Hakulinen T, Soderman B, Verdecchia A. Mixture models for cancer survival analysis: application to population-based data with covariates. Stat.Med 1999;18(4):441–54. [DOI] [PubMed] [Google Scholar]
- 15.Andersson TML, Dickman PW, Eloranta S, Lambert PC. Estimating and modelling cure in population-based cancer studies within the framework of flexible parametric survival models. BMC medical research methodology 2011;11:96. [DOI] [PMC free article] [PubMed] [Google Scholar]
- 16.Lambert PC. Modeling of the cure fraction in survival studies. Stata Journal 2007;7(3):351–75. [Google Scholar]
- 17.Gamel JW, Weller EA, Wesley MN, Feuer EJ. Parametric cure models of relative and cause-specific survival for grouped survival times. Comput Methods Programs Biomed 2000;61(2):99–110. [DOI] [PubMed] [Google Scholar]
- 18.Capocaccia R Relationships between incidence and mortality in non-reversible diseases. Stat Med 1993;12(24):2395–415. [DOI] [PubMed] [Google Scholar]
- 19.Breast - Adjusted AJCC Stage (1988+) (https://seer.cancer.gov/seerstat/variables/seer/ajcc-stage/6th/#stage).
- 20.Howlader N, Ries LA, Mariotto AB, Reichman ME, Ruhl J, Cronin KA. Improved estimates of cancer-specific survival rates from population-based data. J Natl Cancer Inst 2010;102(20):1584–98. [DOI] [PMC free article] [PubMed] [Google Scholar]
- 21.Henderson IC, Berry DA, Demetri GD, Cirrincione CT, Goldstein LJ, Martino S, et al. Improved outcomes from adding sequential Paclitaxel but not from escalating Doxorubicin dose in an adjuvant chemotherapy regimen for patients with node-positive primary breast cancer. J.Clin.Oncol 2003;21(6):976–83. [DOI] [PubMed] [Google Scholar]
- 22.Henderson IC. Adjuvant systemic therapy for early breast cancer. Curr.Probl.Cancer 1987;11(3):125–207. [PubMed] [Google Scholar]
- 23.Citron ML, Berry DA, Cirrincione C, Hudis C, Winer EP, Gradishar WJ, et al. Randomized trial of dose-dense versus conventionally scheduled and sequential versus concurrent combination chemotherapy as postoperative adjuvant treatment of node-positive primary breast cancer: first report of Intergroup Trial C9741/Cancer and Leukemia Group B Trial 9741. J Clin Oncol 2003;21(8):1431–9. [DOI] [PubMed] [Google Scholar]
- 24.Cronin KA, Yu B, Krapcho M, Miglioretti DL, Fay MP, Izmirlian G, et al. Modeling the dissemination of mammography in the United States. Cancer Causes Control 2005;16(6):701–12. [DOI] [PubMed] [Google Scholar]
- 25.Mariotto AB, Feuer EJ, Harlan LC, Abrams J. Dissemination of adjuvant multiagent chemotherapy and tamoxifen for breast cancer in the United States using estrogen receptor information: 1975–1999. J.Natl.Cancer Inst.Monogr 2006(36):7–15. [DOI] [PubMed] [Google Scholar]
- 26.Romond EH, Perez EA, Bryant J, Suman VJ, Geyer CE Jr., Davidson NE, et al. Trastuzumab plus adjuvant chemotherapy for operable HER2-positive breast cancer. N Engl J Med 2005;353(16):1673–84. [DOI] [PubMed] [Google Scholar]
- 27.Perez EA, Romond EH, Suman VJ, Jeong JH, Sledge G, Geyer CE Jr., et al. Trastuzumab plus adjuvant chemotherapy for human epidermal growth factor receptor 2-positive breast cancer: planned joint analysis of overall survival from NSABP B-31 and NCCTG N9831. J Clin Oncol 2014;32(33):3744–52. [DOI] [PMC free article] [PubMed] [Google Scholar]
- 28.Piccart-Gebhart MJ, Procter M, Leyland-Jones B, Goldhirsch A, Untch M, Smith I, et al. Trastuzumab after adjuvant chemotherapy in HER2-positive breast cancer. N Engl J Med 2005;353(16):1659–72. [DOI] [PubMed] [Google Scholar]
- 29.van de Water W, Seynaeve C, Bastiaannet E, Markopoulos C, Jones SE, Rea D, et al. Elderly Postmenopausal Patients With Breast cancer Are at Increased Risk for Distant Recurrence: A Tamoxifen Exemestane Adjuvant Multinational Study Analysis. Oncologist 2013;18(1):8–13. [DOI] [PMC free article] [PubMed] [Google Scholar]
- 30.McBride S, Rieseberg RL, Glidden TL, Huang LG. The Guide to biomedical standards Brea, CA.,: Quest Pub. Co.; 1971:v. [Google Scholar]
- 31.Hilsenbeck SG, Ravdin PM, de Moor CA, Chamness GC, Osborne CK, Clark GM. Time-dependence of hazard ratios for prognostic factors in primary breast cancer. Breast cancer Research and Treatment 1998;52(1–3):227–37. [DOI] [PubMed] [Google Scholar]
- 32.Saphner T, Tormey DC, Gray R. Annual hazard rates of recurrence for breast cancer after primary therapy. Journal of Clinical Oncology 1996;14(10):2738–46. [DOI] [PubMed] [Google Scholar]
- 33.Ravdin PM, Siminoff LA, Davis GJ, Mercer MB, Hewlett J, Gerson N, et al. Computer program to assist in making decisions about adjuvant therapy for women with early breast cancer. Journal of Clinical Oncology 2001;19(4):980–91. [DOI] [PubMed] [Google Scholar]
- 34.Carey LA, Dees EC, Sawyer L, Gatti L, Moore DT, Collichio F, et al. The triple negative paradox: primary tumor chemosensitivity of breast cancer subtypes. Clin Cancer Res 2007;13(8):2329–34. [DOI] [PubMed] [Google Scholar]
- 35.Telli ML, Jensen KC, Vinayak S, Kurian AW, Lipson JA, Flaherty PJ, et al. Phase II Study of Gemcitabine, Carboplatin, and Iniparib As Neoadjuvant Therapy for Triple-Negative and BRCA1/2 Mutation-Associated Breast cancer With Assessment of a Tumor-Based Measure of Genomic Instability: PrECOG 0105. J Clin Oncol 2015;33(17):1895–901. [DOI] [PMC free article] [PubMed] [Google Scholar]
- 36.Gonzalez-Angulo AM, Timms KM, Liu S, Chen H, Litton JK, Potter J, et al. Incidence and outcome of BRCA mutations in unselected patients with triple receptor-negative breast cancer. Clin Cancer Res 2011;17(5):1082–9. [DOI] [PMC free article] [PubMed] [Google Scholar]
- 37.Couch FJ, Hart SN, Sharma P, Toland AE, Wang X, Miron P, et al. Inherited mutations in 17 breast cancer susceptibility genes among a large triple-negative breast cancer cohort unselected for family history of breast cancer. J Clin Oncol 2015;33(4):304–11. [DOI] [PMC free article] [PubMed] [Google Scholar]
- 38.Davies C, Pan H, Godwin J, Gray R, Arriagada R, Raina V, et al. Long-term effects of continuing adjuvant tamoxifen to 10 years versus stopping at 5 years after diagnosis of oestrogen receptor-positive breast cancer: ATLAS, a randomised trial. Lancet 2013;381(9869):805–16. [DOI] [PMC free article] [PubMed] [Google Scholar]
- 39.Goss PE, Ingle JN, Pritchard KI, Robert NJ, Muss H, Gralow J, et al. Extending Aromatase-Inhibitor Adjuvant Therapy to 10 Years. N Engl J Med 2016;375(3):209–19. [DOI] [PMC free article] [PubMed] [Google Scholar]
- 40.Tjan-Heijnen VCG, van Hellemond IEG, Peer PGM, Swinkels ACP, Smorenburg CH, van der Sangen MJC, et al. Extended adjuvant aromatase inhibition after sequential endocrine therapy (DATA): a randomised, phase 3 trial. Lancet Oncology 2017;18(11):1502–11. [DOI] [PubMed] [Google Scholar]
- 41.Blok EJ, Kroep JR, Kranenbarg EMK, Duijm-de Carpentier M, Putter H, van den Bosch J, et al. Optimal Duration of Extended Adjuvant Endocrine Therapy for Early Breast Cancer; Results of the IDEAL Trial (BOOG 2006–05). Jnci-Journal of the National Cancer Institute 2018;110(1):40–48. [DOI] [PubMed] [Google Scholar]
- 42.Mamounas E, Bandos H, Lembersky B, Geyer C, Geyer C, Fehrenbacher L, et al. Effect of extended adjuvant endocrine therapy with letrozole (L) in postmenopausal women with hormone-receptor (+) breast cancer after prior adjuvant therapy with an aromatase inhibitor (AI): NRG Oncology/NSABP B-42. Breast 2017;32:S25–S6. [Google Scholar]
- 43.van den Hurk CJ, Eckel R, van de Poll-Franse LV, Coebergh JW, Nortier JW, Holzel D, et al. Unfavourable pattern of metastases in M0 breast cancer patients during 1978–2008: a population-based analysis of the Munich Cancer Registry. Breast cancer Res Treat 2011;128(3):795–805. [DOI] [PubMed] [Google Scholar]
- 44.Lord SJ, Marinovich ML, Patterson JA, Wilcken N, Kiely BE, Gebski V, et al. Incidence of metastatic breast cancer in an Australian population-based cohort of women with non-metastatic breast cancer at diagnosis. Medical Journal of Australia 2012;196(11):688–92. [DOI] [PubMed] [Google Scholar]
Associated Data
This section collects any data citations, data availability statements, or supplementary materials included in this article.