Figure 7.
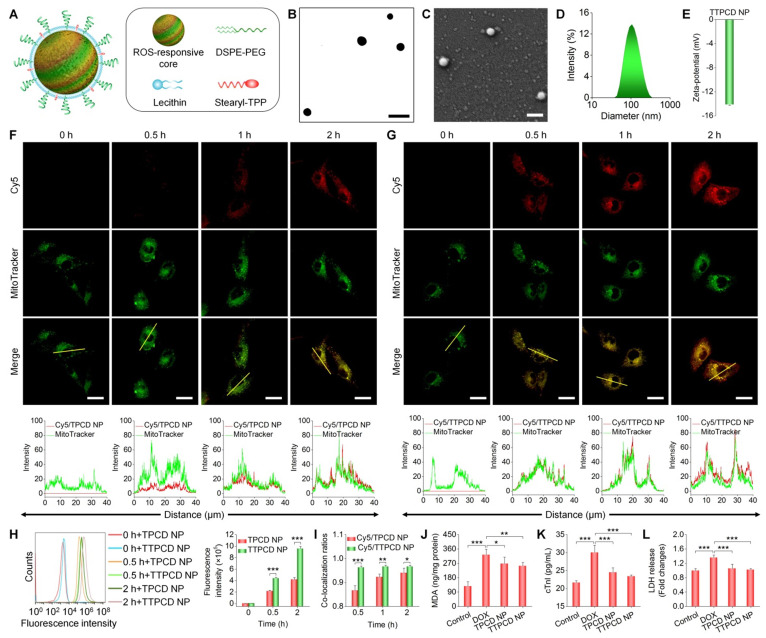
Design, engineering, and biological effects of a mitochondrial-targeting nanotherapy TTPCD NP. (A) Schematic of TPP-decorated TPCD NP (TTPCD NP). (B-E) TEM (B) and SEM (C) images as well as size distribution (D) and zeta-potential (E) of TTPCD NP. (F-G) Confocal microscopy images showing the mitochondrial localization of Cy5/TPCD NP (F) and Cy5/TTPCD NP (G) in H9C2 cells. Images in the lower panels show quantitative analysis of fluorescence intensities along the yellow lines on single cells in indicated images. (H) Flow cytometric curves (left) and quantitative analysis (right) of time-dependent cellular uptake of Cy5/TPCD NP and Cy5/TTPCD NP at 50 µg/mL in H9C2 cells stimulated with DOX. (I) The co-localization ratios of Cy5/TPCD NP or Cy5/TTPCD NP with mitochondria. (J) Intracellular MDA levels after DOX stimulation and treatment with TPCD NP or TTPCD NP at 50 µg/mL. The protein content was measured by the BCA assay. (K-L) Expression levels of cTnI (K) and LDH (L) by H9C2 cells after stimulation with DOX and treatment with TPCD NP or TTPCD NP. Scale bars: 200 nm (B-C), 20 μm (F-G). Data are mean ± SD (E,H-I, n = 3; J-L, n = 4). Statistical significance was assessed by the unpaired t-test for data in (H-I) and the one-way ANOVA with post-hoc LSD tests for data in (J-L). *P < 0.05, **P < 0.01, ***P < 0.001.

