Figure 4.
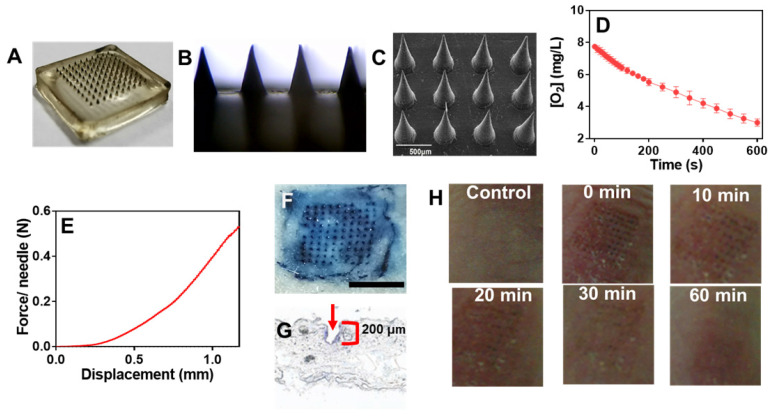
(A) High-resolution digital image and (B) micrograph of GOx@PDA MNs. (C) SEM image of GOx@PDA MNs in drying state, (Scale bar: 500 μm). (D) Rate of O2 consumption to measure the GOx@PDA loading into MNs. The assay was performed in presence of 2.5 mg/mL glucose. (E) Mechanical property of the MN. The failure force for desired MN was quantitatively measured as 0.58 N/needle. (F) Trypan blue staining showing MN penetration into mouse skin. Scale bar: 1 mm. (G) Image of frozen tissue sections to observe the cross-sectional area of mouse skin, which indicates penetration depth of MNs. The arrow indicates the insertion site. (G) The appearance of the skin before and after treatment with MNs at different timepoints.

