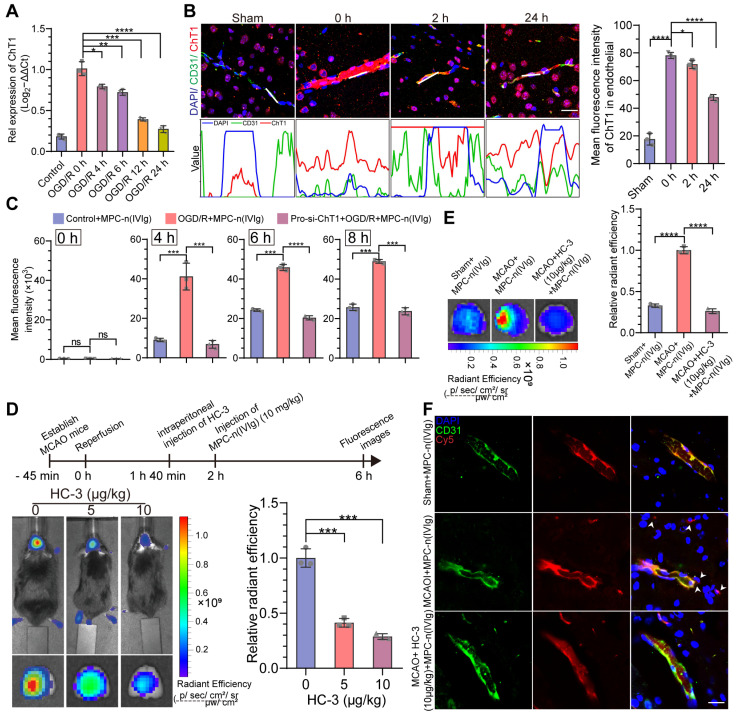
Figure 3.
MPC-n(IVIg) selectively targets ischemic areas in a ChT1-dependent manner in endothelial cells during ischemic stroke. A) qRT-PCR analysis for the mRNA levels of ChT1 in bEND.3 cells subjected to OGD for 12 h and reperfused for 0, 4, 6, 12, and 24 h (n = 3). B) Immunofluorescence for the localization of ChT1 and CD31 on the endothelial cell surface in MCAO mice. The gray values are shown in the line plots. Scale bar = 20 μm. The histogram summarizes the mean fluorescence intensity of ChT1 (n = 3). C) Flow cytometry for the uptake of MPC-n(IVIg) by bEND.3 cells following incubation with MPC-n(IVIg) (1 mg/mL) for 0, 4, 6, and 8 h with reperfusion in the control+MPC-n(IVIg), OGD+MPC-n(IVIg), and pro-si-ChT1+OGD+MPC-n(IVIg) groups (n = 3). D) In vivo whole C57 mice imaging of Cy5 signal 4 h post intravenous injection with MPC-n(IVIg) (10 mg/kg) at 2 h post-ischemia-reperfusion in MCAO mice intraperitoneally preinjected with different doses of HC-3 20 min prior to the injection of MPC-n(IVIg). Ex vivo Cy5 signal images of the isolated brain tissue from the treated mice 4 h post-injection. The histogram summarizes the relative radiant efficiency of the isolated brain tissue (n = 3). E) Ex vivo Cy5 images of the isolated brain tissue from treated mice [sham+MPC-n(IVIg), MCAO+MPC-n(IVIg), and MCAO+HC-3 (10 μg/kg)+MPC-n(IVIg)] 24 h post-injection. The histogram summarizes the relative radiant efficiency of the brain tissue (n = 3). F) Immunofluorescence for the colocalization of Cy5-labeled IVIg, CD31, and DAPI-stained nuclei in the brain tissue from the treated mice 24 h post-injection. Scale bar = 20 μm. All experiments were repeated independently three times. All data are presented as the mean ± S.D. ns, nonsignificant, *P < 0.05, **P < 0.01, or ***P < 0.001.

