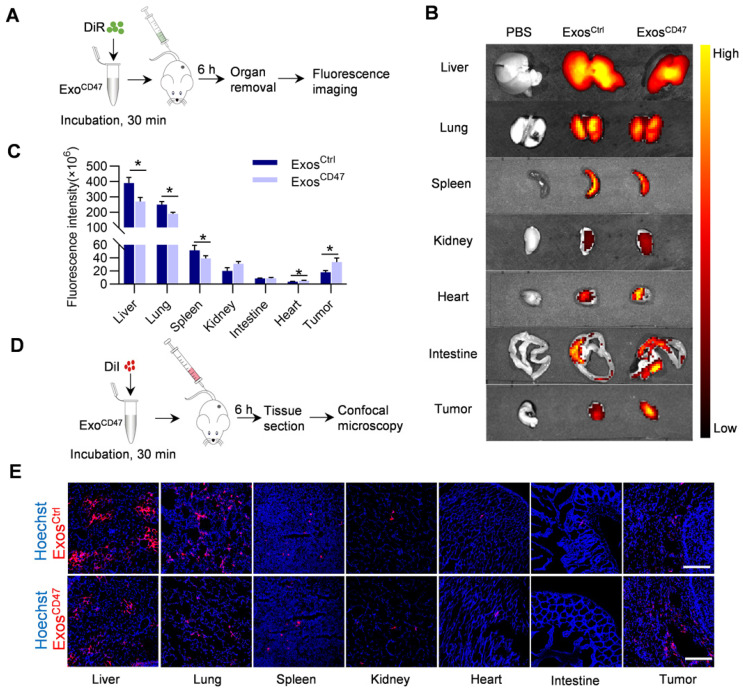
Figure 3.
ExosCD47 escape from MPS in vivo. (A) Schematic illustration of the experimental procedure. (B) Representative ex vivo fluorescent images of the DiR-labeled exosomes in tumors and main organs. n = 5 mice. (C) Quantification of fluorescence intensity of different organs and tumors. Data are presented as the mean ± SEM, n = 5, *, P < 0.05. (D) Schematic illustration of the experimental procedure. (E) Representative fluorescence images of the DiI-labeled exosomes (red) in tumors and main organs. The nuclei were counter-stained with Hoechst (blue). Scale bar = 100 μm, n = 5 mice.

