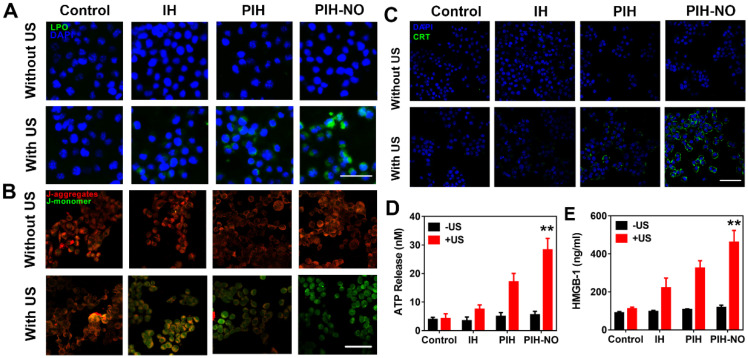
Figure 5.
Mitochondria destruction and ICD induced by PIH-NO. (A) Fluorescence images of lipid peroxide in 4T1 cells with different treatments detected by Liperfluo (green fluorescence) for the lipid peroxide-specific oxidation. The scale bar is 100 μm. (B) Mitochondrial membrane potential stained with JC-1 after various treatments. The scale bar is 100 μm. (C) CRT exposure on the surface of 4T1 cells. The scale bar is 100 μm. (D) Extracellular ATP and (E) HMGB-1 release from 4T1 tumor cells after various treatments. **p <0.01 (PIH-NO with US vs. other treatments). Data are expressed as means ± SD (n = 3).

